Kodak 2013 Annual Report Download - page 39
Download and view the complete annual report
Please find page 39 of the 2013 Kodak annual report below. You can navigate through the pages in the report by either clicking on the pages listed below, or by using the keyword search tool below to find specific information within the annual report.-
 1
1 -
2
-
3
-
4
-
5
-
6
-
7
-
8
-
9
-
10
-
11
-
12
-
13
-
14
-
15
-
16
-
17
-
18
-
19
-
20
-
21
-
22
-
23
-
24
-
25
-
26
-
27
-
28
-
 29
29 -
 30
30 -
 31
31 -
 32
32 -
 33
33 -
 34
34 -
 35
35 -
 36
36 -
 37
37 -
 38
38 -
 39
39 -
 40
40 -
 41
41 -
 42
42 -
 43
43 -
 44
44 -
 45
45 -
 46
46 -
 47
47 -
 48
48 -
 49
49 -
50
-
51
-
52
-
53
-
54
-
55
-
56
-
57
-
58
-
59
-
60
-
61
-
62
-
63
-
64
-
65
-
66
-
67
-
68
-
69
-
70
-
71
-
72
-
73
-
74
-
75
-
76
-
77
-
78
-
79
-
80
-
81
-
82
-
83
-
84
-
85
-
86
-
87
-
88
-
89
-
90
-
91
-
92
-
93
-
94
-
95
-
96
-
97
-
98
-
99
-
100
-
101
-
102
-
103
-
104
-
105
-
106
-
107
-
108
-
109
-
110
-
111
-
112
-
113
-
114
-
115
-
116
-
117
-
118
-
119
-
120
-
121
-
122
-
123
-
124
-
125
-
126
-
127
-
128
-
129
-
130
-
131
-
132
-
133
-
134
-
135
-
136
-
137
-
138
-
139
-
140
-
141
-
142
-
143
-
144
-
145
-
146
-
147
-
148
-
149
-
150
-
151
-
152
-
153
-
154
-
155
-
156
-
157
-
158
-
159
-
160
-
161
-
162
-
163
-
164
-
165
-
166
-
167
-
168
-
169
-
170
-
171
-
172
-
173
-
174
-
175
-
176
-
177
-
178
 |
 |
Table of Contents
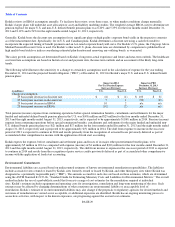
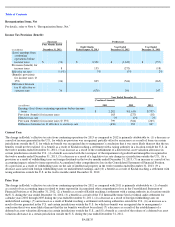
GRAPHICS, ENTERTAINMENT AND COMMERCIAL FILMS
Revenues
Current Year
The decrease in the Graphics, Entertainment and Commercial Films Segment net sales of approximately 10% for the year ended December 31,
2013 was primarily due to volume declines within Entertainment Imaging & Commercial Films (-9%), largely attributable to reduced demand
from movie studios, and within Graphics (-7%), largely attributable to lower demand for digital plates. Also contributing to the decline was
unfavorable price/mix within Graphics (-2%) due to pricing pressures in the industry. Partially offsetting these declines was favorable
price/mix within Intellectual Property and Brand Licensing (+6%) due to non-recurring intellectual property licensing agreements and within
Entertainment Imaging and Commercial Films
(+3%) due to pricing actions impacting the current year. The impact of the application of fresh
start accounting was not material.
Included in revenues were non-recurring intellectual property licensing agreements. Such agreements contributed approximately $38 million to
revenues in 2013. There were no significant non-recurring intellectual property licensing agreements in 2012. However, there was a $61
million licensing revenue reduction reflecting sharing, with licensees, of the withholding tax refund received in 2012 (refer to Note 17,
“Income Taxes” for additional information).
Prior Year
The decrease in the Graphics, Entertainment and Commercial Films Segment net sales of approximately 28% for the year ended December 31,
2012 was primarily driven by volume declines within Entertainment Imaging & Commercial Films (-10%), largely attributable to reduced
demand from movie studios, and within Graphics (-8%), largely attributable to lower demand. Also contributing to the revenue decline was
lower revenue within Intellectual Property and Brand Licensing (-
6%) due to the $61 million license revenue reduction reflecting sharing, with
licensees, of the withholding tax refund received in the first quarter of 2012 (refer to Note 17, “Income Taxes” for additional information).
Non
-recurring intellectual property licensing agreements contributed $82 million to revenues in 2011.
PAGE 37
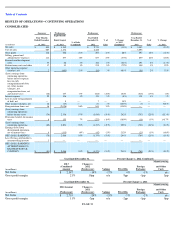
Successor
Predecessor
Predecessor
Predecessor
(in millions)
Four Months Ended
December 31, 2013
Eight Months
Ended August 31,
2013
% of Sales
(Combined)
Year Ended
December 31,
2012
% of
Sales
% Change
vs. 2012
(Combined)
Year Ended
December 31,
2011
% of
Sales
% Change
vs. 2011
Net sales
$
519
$
987
$
1,680
(10
%)
$
2,341
(28
%)
Cost of sales
472
805
1,509
(15
%)
1,853
(19
%)
Gross profit
47
182
15
%
171
10
%
34
%
488
21
%
(65
%)
Selling, general and
administrative
expenses
77
164
16
%
341
20
%
(29
%)
439
19
%
(22
%)
Research and
development
costs
7
13
1
%
40
2
%
(50
%)
57
2
%
(30
%)
Segment (loss)
earnings
$
(37
)
$
5
(2
%)
$
(210
)
(13
%)
85
%
$
(8
)
—
(
2,525
%)
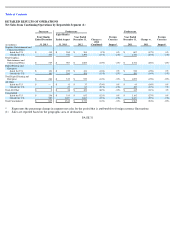
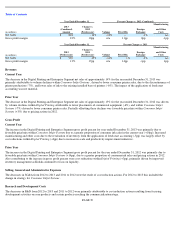
Year Ended December 31,
Percent Change vs. 2012 (Combined)
(in millions)
2013
(Combined)
Amount
Change vs.
2012
(Predecessor)
Volume
Price/Mix
Foreign
Exchange
Manufacturing
and Other
Costs
Net Sales
$
1,506
-
10
%
-
16
%
7
%
-
1
%
n/a
Gross profit margin
15
%
5pp
n/a
6pp
-
1pp
0pp
Year Ended December 31,
Percent Change vs. 2011
(in millions)
2012
(Predecessor)
Change vs.
2011
(Predecessor)
Volume
Price/Mix
Foreign
Exchange
Manufacturing
and Other
Costs
Net Sales
$
1,680
-
28
%
-
18
%
-
8
%
-
2
%
n/a
Gross profit margin
10
%
-
11pp
n/a
-
10pp
0pp
-
1pp