Kodak 2013 Annual Report Download - page 121
Download and view the complete annual report
Please find page 121 of the 2013 Kodak annual report below. You can navigate through the pages in the report by either clicking on the pages listed below, or by using the keyword search tool below to find specific information within the annual report.-
 1
1 -
2
-
3
-
4
-
5
-
6
-
7
-
8
-
9
-
10
-
11
-
12
-
13
-
14
-
15
-
16
-
17
-
18
-
19
-
20
-
21
-
22
-
23
-
24
-
25
-
26
-
27
-
28
-
29
-
30
-
31
-
32
-
33
-
34
-
35
-
36
-
37
-
38
-
39
-
40
-
41
-
42
-
43
-
44
-
45
-
46
-
47
-
48
-
49
-
50
-
51
-
52
-
53
-
54
-
55
-
56
-
57
-
58
-
59
-
60
-
61
-
62
-
63
-
64
-
65
-
66
-
67
-
68
-
69
-
70
-
71
-
72
-
73
-
74
-
75
-
76
-
77
-
78
-
79
-
80
-
81
-
82
-
83
-
84
-
85
-
86
-
87
-
88
-
89
-
90
-
91
-
92
-
93
-
94
-
95
-
96
-
97
-
98
-
99
-
100
-
101
-
102
-
103
-
104
-
105
-
106
-
107
-
108
-
109
-
110
-
 111
111 -
 112
112 -
 113
113 -
 114
114 -
 115
115 -
 116
116 -
 117
117 -
 118
118 -
 119
119 -
 120
120 -
 121
121 -
 122
122 -
 123
123 -
 124
124 -
 125
125 -
 126
126 -
 127
127 -
 128
128 -
 129
129 -
 130
130 -
 131
131 -
132
-
133
-
134
-
135
-
136
-
137
-
138
-
139
-
140
-
141
-
142
-
143
-
144
-
145
-
146
-
147
-
148
-
149
-
150
-
151
-
152
-
153
-
154
-
155
-
156
-
157
-
158
-
159
-
160
-
161
-
162
-
163
-
164
-
165
-
166
-
167
-
168
-
169
-
170
-
171
-
172
-
173
-
174
-
175
-
176
-
177
-
178
 |
 |

Table of Contents
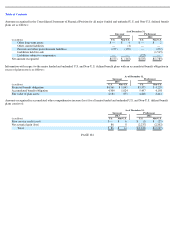
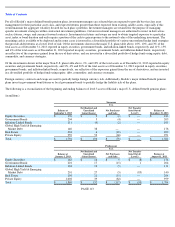
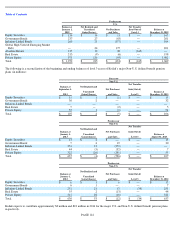
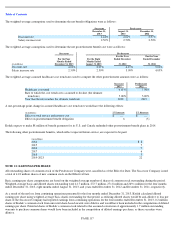
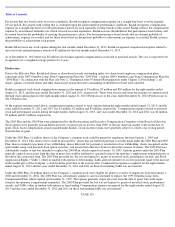
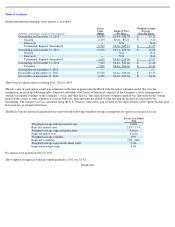
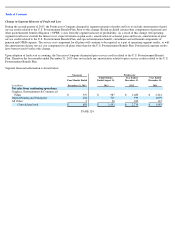
The following is a reconciliation of the beginning and ending balances of level 3 assets of Kodak’s major Non-U.S. defined benefit pension
plans (in millions):
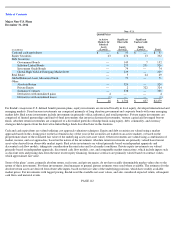
Kodak expects to contribute approximately $0 million and $18 million in 2014 for the major U.S. and Non-U.S. defined benefit pension plans,
respectively.
PAGE 114
Predecessor
U.S.
Balance at
January 1,
2012
Net Realized and
Unrealized
Gains/(Losses)
Net Purchases
and Sales
Net Transfer
Into/(Out of)
Level 3
Balance at
December 31, 2012
Equity Securities
$
136
$
16
$
11
$
—
$
163
Government Bonds
237
27
(63
)
—
201
Inflation
-
Linked Bonds
260
21
(177
)
—
104
Global High Yield & Emerging Market
Debt
—
24
177
—
201
Absolute Return
135
10
20
(165
)
—
Real Estate
213
(9
)
(6
)
—
198
Private Equity
971
126
(95
)
—
1,002
Total
$
1,952
$
215
$
(133
)
$
(165
)
$
1,869
Successor
Non
-
U.S.
Balance at
September 1,
2013
Net Realized and
Unrealized
Gains/(Losses)
Net Purchases
and Sales
Net Transfer
Into/(Out of)
Level 3
Balance at
December 31, 2013
Equity Securities
$
15
$
1
$
(1
)
$
—
$
15
Government Bonds
30
2
—
—
32
Inflation
-
Linked Bonds
—
—
—
—
—
Real Estate
7
—
(
2
)
—
5
Private Equity
55
1
(2
)
—
54
Total
$
107
$
4
$
(5
)
$
—
$
106
Predecessor
Non
-
U.S.
Balance at
January 1,
2013
Net Realized and
Unrealized
Gains/(Losses)
Net Purchases
and Sales
Net Transfer
Into/(Out of)
Level 3
Balance at
August 31, 2013
Equity Securities
$
13
$
2
$
—
$
—
$
15
Government Bonds
7
4
19
—
30
Inflation
-
Linked Bonds
251
21
(272
)
—
—
Real Estate
44
(5
)
(32
)
—
7
Private Equity
322
(26
)
(241
)
—
55
Total
$
637
$
(4
)
$
(526
)
$
—
$
107
Predecessor
Non
-
U.S.
Balance at
January 1,
2012
Net Realized and
Unrealized
Gains/(Losses)
Net Purchases
and Sales
Net Transfer
Into/(Out of)
Level 3
Balance at
December 31, 2012
Equity Securities
$
6
$
1
$
6
$
—
$
13
Government Bonds
6
1
—
—
7
Inflation
-
Linked Bonds
251
21
13
(34
)
251
Real Estate
55
2
(13
)
—
44
Private Equity
312
28
(18
)
—
322
Total
$
630
$
53
$
(12
)
$
(34
)
$
637