Kodak 2013 Annual Report Download - page 115
Download and view the complete annual report
Please find page 115 of the 2013 Kodak annual report below. You can navigate through the pages in the report by either clicking on the pages listed below, or by using the keyword search tool below to find specific information within the annual report.-
 1
1 -
2
-
3
-
4
-
5
-
6
-
7
-
8
-
9
-
10
-
11
-
12
-
13
-
14
-
15
-
16
-
17
-
18
-
19
-
20
-
21
-
22
-
23
-
24
-
25
-
26
-
27
-
28
-
29
-
30
-
31
-
32
-
33
-
34
-
35
-
36
-
37
-
38
-
39
-
40
-
41
-
42
-
43
-
44
-
45
-
46
-
47
-
48
-
49
-
50
-
51
-
52
-
53
-
54
-
55
-
56
-
57
-
58
-
59
-
60
-
61
-
62
-
63
-
64
-
65
-
66
-
67
-
68
-
69
-
70
-
71
-
72
-
73
-
74
-
75
-
76
-
77
-
78
-
79
-
80
-
81
-
82
-
83
-
84
-
85
-
86
-
87
-
88
-
89
-
90
-
91
-
92
-
93
-
94
-
95
-
96
-
97
-
98
-
99
-
100
-
101
-
102
-
103
-
104
-
 105
105 -
 106
106 -
 107
107 -
 108
108 -
 109
109 -
 110
110 -
 111
111 -
 112
112 -
 113
113 -
 114
114 -
 115
115 -
 116
116 -
 117
117 -
 118
118 -
 119
119 -
 120
120 -
 121
121 -
 122
122 -
 123
123 -
 124
124 -
 125
125 -
126
-
127
-
128
-
129
-
130
-
131
-
132
-
133
-
134
-
135
-
136
-
137
-
138
-
139
-
140
-
141
-
142
-
143
-
144
-
145
-
146
-
147
-
148
-
149
-
150
-
151
-
152
-
153
-
154
-
155
-
156
-
157
-
158
-
159
-
160
-
161
-
162
-
163
-
164
-
165
-
166
-
167
-
168
-
169
-
170
-
171
-
172
-
173
-
174
-
175
-
176
-
177
-
178
 |
 |

Table of Contents
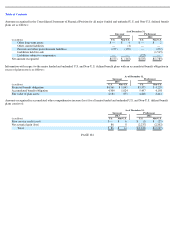
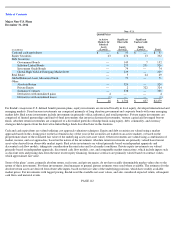
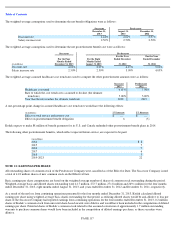
The Company’s weighted-average asset allocations for its major U.S. defined benefit pension plans by asset category, are as follows:
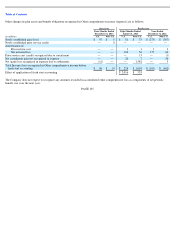
The Company’s weighted-average asset allocations for its major Non-U.S. defined benefit pension plans by asset category, are as follows:
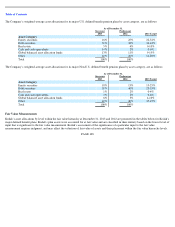
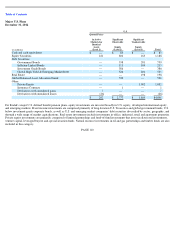
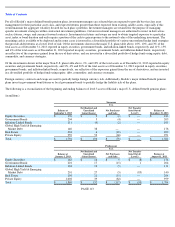
Fair Value Measurements
Kodak’s asset allocations by level within the fair value hierarchy at December 31, 2013 and 2012 are presented in the tables below for Kodak’
s
major defined benefit plans. Kodak’s plan assets were accounted for at fair value and are classified in their entirety based on the lowest level of
input that is significant to the fair value measurement. Kodak’s assessment of the significance of a particular input to the fair value
measurement requires judgment, and may affect the valuation of fair value of assets and their placement within the fair value hierarchy levels.
PAGE 108
As of December 31,
Successor
Predecessor
2013
2012
2013 Target
Asset Category
Equity securities
16
%
25
%
22
-
32%
Debt securities
30
%
38
%
34
-
44%
Real estate
5
%
4
%
0
-
10%
Cash and cash equivalents
14
%
2
%
0
-
6%
Global balanced asset allocation funds
13
%
11
%
9
-
15%
Other
22
%
20
%
14
-
20%
Total
100
%
100
%
As of December 31,
Successor
Predecessor
2013
2012
2013 Target
Asset Category
Equity securities
18
%
13
%
15
-
25%
Debt securities
30
%
40
%
25
-
35%
Real estate
1
%
2
%
0
-
4%
Cash and cash equivalents
3
%
2
%
0
-
6%
Global balanced asset allocation funds
6
%
3
%
4
-
10%
Other
42
%
40
%
35
-
45%
Total
100
%
100
%