Kodak 2013 Annual Report Download - page 60
Download and view the complete annual report
Please find page 60 of the 2013 Kodak annual report below. You can navigate through the pages in the report by either clicking on the pages listed below, or by using the keyword search tool below to find specific information within the annual report.-
 1
1 -
2
-
3
-
4
-
5
-
6
-
7
-
8
-
9
-
10
-
11
-
12
-
13
-
14
-
15
-
16
-
17
-
18
-
19
-
20
-
21
-
22
-
23
-
24
-
25
-
26
-
27
-
28
-
29
-
30
-
31
-
32
-
33
-
34
-
35
-
36
-
37
-
38
-
39
-
40
-
41
-
42
-
43
-
44
-
45
-
46
-
47
-
48
-
49
-
 50
50 -
 51
51 -
 52
52 -
 53
53 -
 54
54 -
 55
55 -
 56
56 -
 57
57 -
 58
58 -
 59
59 -
 60
60 -
 61
61 -
 62
62 -
 63
63 -
 64
64 -
 65
65 -
 66
66 -
 67
67 -
 68
68 -
 69
69 -
 70
70 -
71
-
72
-
73
-
74
-
75
-
76
-
77
-
78
-
79
-
80
-
81
-
82
-
83
-
84
-
85
-
86
-
87
-
88
-
89
-
90
-
91
-
92
-
93
-
94
-
95
-
96
-
97
-
98
-
99
-
100
-
101
-
102
-
103
-
104
-
105
-
106
-
107
-
108
-
109
-
110
-
111
-
112
-
113
-
114
-
115
-
116
-
117
-
118
-
119
-
120
-
121
-
122
-
123
-
124
-
125
-
126
-
127
-
128
-
129
-
130
-
131
-
132
-
133
-
134
-
135
-
136
-
137
-
138
-
139
-
140
-
141
-
142
-
143
-
144
-
145
-
146
-
147
-
148
-
149
-
150
-
151
-
152
-
153
-
154
-
155
-
156
-
157
-
158
-
159
-
160
-
161
-
162
-
163
-
164
-
165
-
166
-
167
-
168
-
169
-
170
-
171
-
172
-
173
-
174
-
175
-
176
-
177
-
178
 |
 |
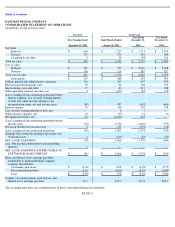
Table of Contents
EASTMAN KODAK COMPANY
CONSOLIDATED STATEMENT OF CASH FLOWS
(in millions)
Successor
Predecessor
Four Months
Ended December 31,
2013
Eight Months
Ended August 31,
2013
Year Ended
December 31, 2012
Year Ended
December 31, 2011
Cash flows from operating activities:
Net (loss) earnings
$
(81
)
$
2,066
$
(1,379
)
$
(764
)
Adjustments to reconcile to net cash used in
operating activities:
Depreciation and amortization
75
118
245
294
Net gains on sales of businesses/assets
(6
)
(407
)
(42
)
(80
)
Loss on early extinguishment of debt
—
8
7
—
Non
-cash restructuring costs, asset
impairments and other charges
9
81
34
17
Reorganization items:
Non
-
cash reorganization gain
—
(
1,964
)
—
—
Payment of claims
—
(
94
)
—
—
Fresh start adjustments, net
—
(
302
)
—
—
Other non-cash reorganization items,
net
3
119
717
—
(Benefit) provision for deferred income taxes
(2
)
448
(20
)
14
(Increase) decrease in receivables
(72
)
105
319
102
Decrease (increase) in inventories
147
(27
)
60
128
Decrease in liabilities excluding borrowings
(166
)
(450
)
(808
)
(903
)
Other items, net
(5
)
(266
)
578
167
Total adjustments
(17
)
(2,631
)
1,090
(261
)
Net cash used in operating activities
(98
)
(565
)
(289
)
(1,025
)
Cash flows from investing activities:
Additions to properties
(21
)
(18
)
(42
)
(101
)
Proceeds from sales of businesses/assets
9
827
90
153
Use (funding) of restricted cash
93
(134
)
—
(
22
)
Business acquisitions, net of cash acquired
—
—
—
(
27
)
Marketable securities
–
sales
—
21
95
83
Marketable securities
–
purchases
—
(
17
)
(91
)
(84
)
Net cash provided by investing activities
81
679
52
2
Cash flows from financing activities:
Proceeds from Emergence credit facilities
—
664
—
—
Proceeds from Senior and Junior DIP Credit
Agreements
—
450
686
—
Proceeds from other borrowings
—
—
—
412
Repayment of term loans under Original
Senior DIP Credit Agreement
—
(
664
)
(36
)
—
Repayment of term loans under Junior DIP
Credit Agreement
—
(
844
)
—
—
Repayment of emergence credit facilities
(2
)
—
—
—
Repayment of other borrowings
(40
)
(375
)
(142
)
(160
)
Proceeds from Rights Offerings
—
406
—
—
Contingent consideration received with sale
of business
—
35
—
—
Reorganization items
—
—
(
41
)
—
Debt issuance costs
—
—
(
6
)
Proceeds from sale and leaseback transaction
—
—
41
—
Net cash (used in) provided by financing
activities
(42
)
(328
)
508
246
Effect of exchange rate changes on cash
5
(23
)
3
14
Net (decrease) increase in cash and cash
equivalents
(54
)
(237
)
274
(763
)
Cash and cash equivalents, beginning of
period
898
1,135
861
1,624