Kodak 2013 Annual Report Download - page 43
Download and view the complete annual report
Please find page 43 of the 2013 Kodak annual report below. You can navigate through the pages in the report by either clicking on the pages listed below, or by using the keyword search tool below to find specific information within the annual report.-
 1
1 -
2
-
3
-
4
-
5
-
6
-
7
-
8
-
9
-
10
-
11
-
12
-
13
-
14
-
15
-
16
-
17
-
18
-
19
-
20
-
21
-
22
-
23
-
24
-
25
-
26
-
27
-
28
-
29
-
30
-
31
-
32
-
 33
33 -
 34
34 -
 35
35 -
 36
36 -
 37
37 -
 38
38 -
 39
39 -
 40
40 -
 41
41 -
 42
42 -
 43
43 -
 44
44 -
 45
45 -
 46
46 -
 47
47 -
 48
48 -
 49
49 -
 50
50 -
 51
51 -
 52
52 -
 53
53 -
54
-
55
-
56
-
57
-
58
-
59
-
60
-
61
-
62
-
63
-
64
-
65
-
66
-
67
-
68
-
69
-
70
-
71
-
72
-
73
-
74
-
75
-
76
-
77
-
78
-
79
-
80
-
81
-
82
-
83
-
84
-
85
-
86
-
87
-
88
-
89
-
90
-
91
-
92
-
93
-
94
-
95
-
96
-
97
-
98
-
99
-
100
-
101
-
102
-
103
-
104
-
105
-
106
-
107
-
108
-
109
-
110
-
111
-
112
-
113
-
114
-
115
-
116
-
117
-
118
-
119
-
120
-
121
-
122
-
123
-
124
-
125
-
126
-
127
-
128
-
129
-
130
-
131
-
132
-
133
-
134
-
135
-
136
-
137
-
138
-
139
-
140
-
141
-
142
-
143
-
144
-
145
-
146
-
147
-
148
-
149
-
150
-
151
-
152
-
153
-
154
-
155
-
156
-
157
-
158
-
159
-
160
-
161
-
162
-
163
-
164
-
165
-
166
-
167
-
168
-
169
-
170
-
171
-
172
-
173
-
174
-
175
-
176
-
177
-
178
 |
 |

Table of Contents
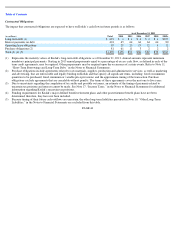
LIQUIDITY AND CAPIT AL RESOURCES
2013
Sources and uses of cash at emergence (including divesture of the Personalized Imaging and Document Imaging businesses) follow:
Cash Flow Activity
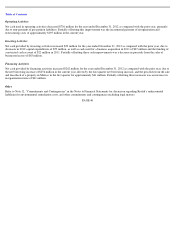
Operating Activities
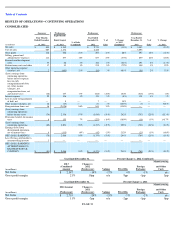
Net cash used in operating activities increased $374 million for the year ended December 31, 2013 as compared with the prior year due to
emergence related cash outflows and less cash being provided by working capital changes as compared to the prior year, partially offset by
earnings improvement.
Investing Activities
Net cash provided by investing activities increased $708 million for the year ended December 31, 2013 as compared with the prior year,
primarily due to the increase in proceeds from sales of businesses/assets of $746 million. The sale of the digital imaging patent portfolio
contributed approximately $530 million in the current year. The sale of the Personalized Imaging and Document Imaging businesses
contributed $290 million to investing activities in the current year. Partially offsetting these increases was the net funding of restricted cash and
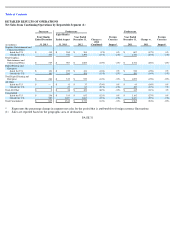
As of December 31,
Successor
Predecessor
(in millions)
2013
2012
Cash and cash equivalents
$
844
$
1,135
(in millions)
Sources:
Net Proceeds from Emergence Credit Facilities
$
664
Proceeds from divestiture
325
Proceeds from Rights Offerings
406
Total sources
$
1,395
Uses:
Repayment of Junior DIP Term Loan
$
844
Repayment of Second Lien Notes
375
Claims paid at emergence
94
Funding of escrow accounts
113
Other fees & expenses
16
Total uses
$
1,442
Net uses
$
(47
)
(in millions)
Successor
Predecessor
Predecessor
Four Months Ended
December 31,
2013
Eight Months
Ended August 31,
2013
Year Ended
December 31,
2012
Computed
Change vs 2012
(2013 Combined)
Cash flows from operating
activities:
Net cash used in operating activities
$
(98
)
$
(565
)
$
(289
)
$
(374
)
Cash flows from investing
activities:
Net cash provided by investing
activities
81
679
52
708
Cash flows from financing
activities:
Net cash (used in) provided by
financing activities
(42
)
(328
)
508
(878
)
Effect of exchange rate changes on
cash
5
(23
)
3
(21
)
Net (decrease) increase in cash and
cash equivalents
$
(54
)
$
(237
)
$
274
$
(565
)