Kodak 2013 Annual Report Download - page 35
Download and view the complete annual report
Please find page 35 of the 2013 Kodak annual report below. You can navigate through the pages in the report by either clicking on the pages listed below, or by using the keyword search tool below to find specific information within the annual report.-
 1
1 -
2
-
3
-
4
-
5
-
6
-
7
-
8
-
9
-
10
-
11
-
12
-
13
-
14
-
15
-
16
-
17
-
18
-
19
-
20
-
21
-
22
-
23
-
24
-
 25
25 -
 26
26 -
 27
27 -
 28
28 -
 29
29 -
 30
30 -
 31
31 -
 32
32 -
 33
33 -
 34
34 -
 35
35 -
 36
36 -
 37
37 -
 38
38 -
 39
39 -
 40
40 -
 41
41 -
 42
42 -
 43
43 -
 44
44 -
 45
45 -
46
-
47
-
48
-
49
-
50
-
51
-
52
-
53
-
54
-
55
-
56
-
57
-
58
-
59
-
60
-
61
-
62
-
63
-
64
-
65
-
66
-
67
-
68
-
69
-
70
-
71
-
72
-
73
-
74
-
75
-
76
-
77
-
78
-
79
-
80
-
81
-
82
-
83
-
84
-
85
-
86
-
87
-
88
-
89
-
90
-
91
-
92
-
93
-
94
-
95
-
96
-
97
-
98
-
99
-
100
-
101
-
102
-
103
-
104
-
105
-
106
-
107
-
108
-
109
-
110
-
111
-
112
-
113
-
114
-
115
-
116
-
117
-
118
-
119
-
120
-
121
-
122
-
123
-
124
-
125
-
126
-
127
-
128
-
129
-
130
-
131
-
132
-
133
-
134
-
135
-
136
-
137
-
138
-
139
-
140
-
141
-
142
-
143
-
144
-
145
-
146
-
147
-
148
-
149
-
150
-
151
-
152
-
153
-
154
-
155
-
156
-
157
-
158
-
159
-
160
-
161
-
162
-
163
-
164
-
165
-
166
-
167
-
168
-
169
-
170
-
171
-
172
-
173
-
174
-
175
-
176
-
177
-
178
 |
 |
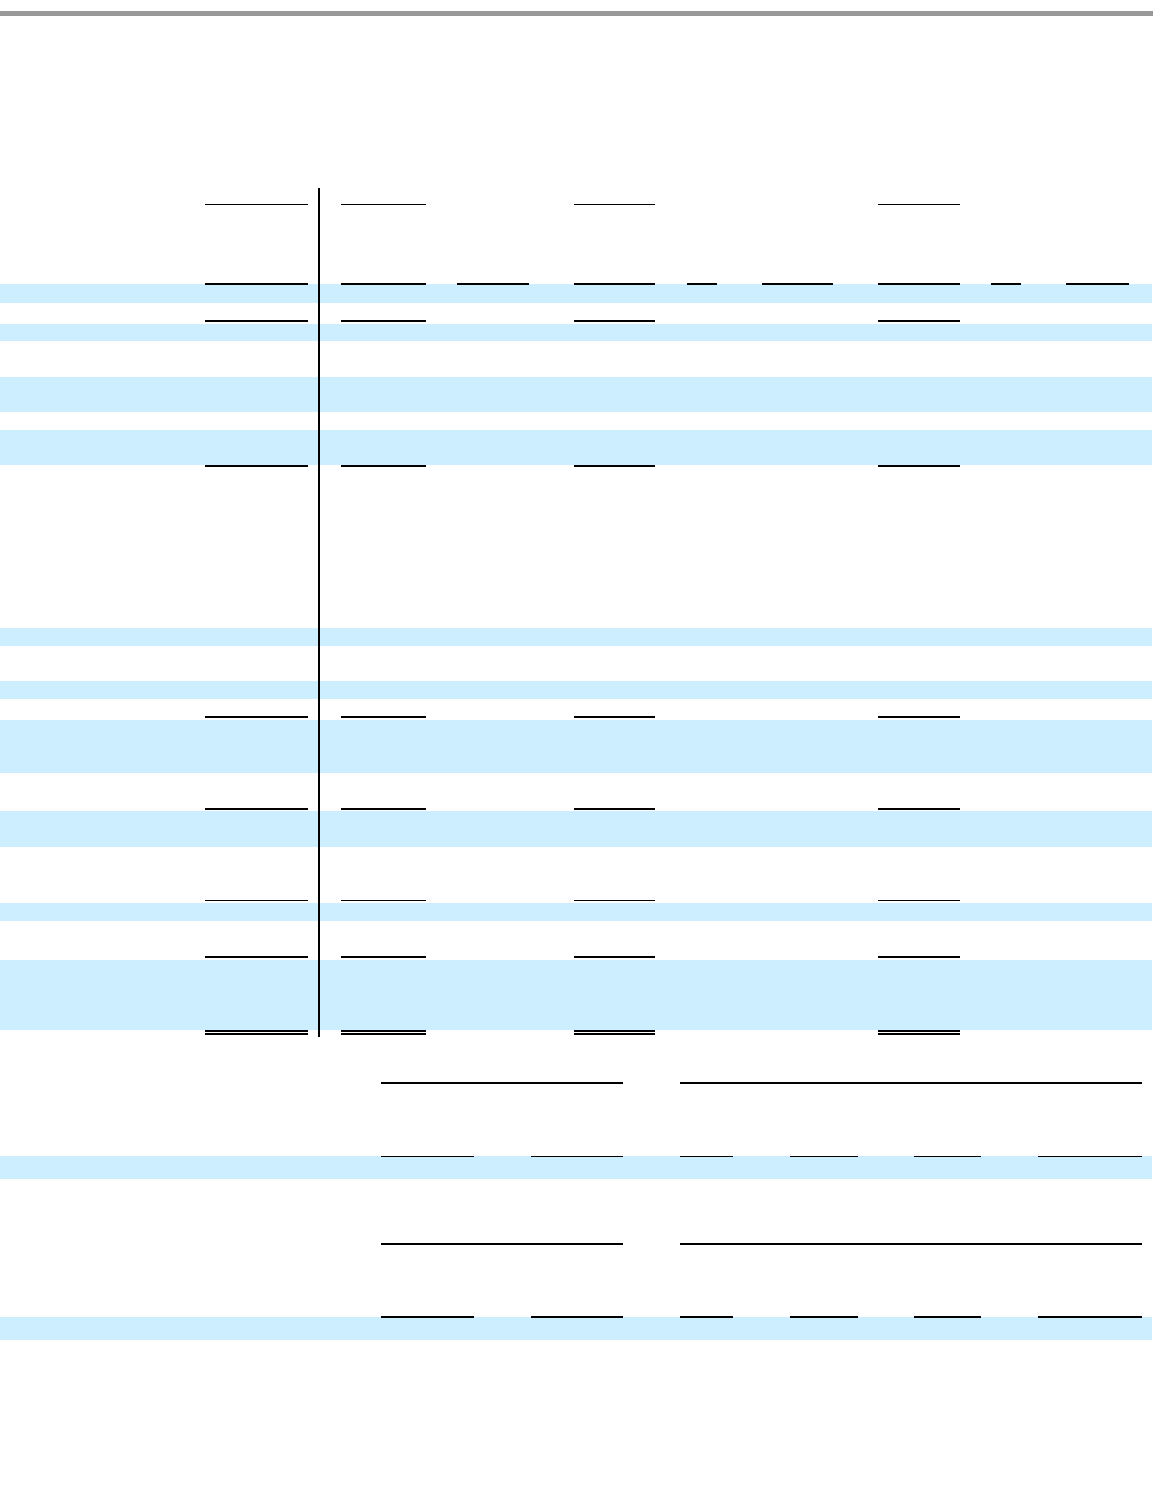
Table of Contents
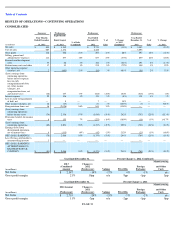
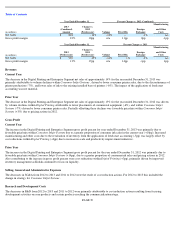
RESULTS OF OPERATIONS—CONTINUING OPERATIONS
CONSOLIDATED
PAGE 33
Successor
Predecessor
Predecessor
Predecessor
(in millions)
Four Months
Ended December
31, 2013
Eight Months
Ended August
31, 2013
% of Sales
(Combined)
Year Ended
December 31,
2012
% of
Sales
% Change
vs. 2012
(Combined)
Year Ended
December 31,
2011
% of
Sales
% Change
vs. 2011
Net sales
$
805
$
1,542
$
2,719
(14
%)
$
3,585
(24
%)
Cost of sales
687
1,174
2,426
3,095
Gross profit
118
368
21
%
293
11
%
66
%
490
14
%
(40
%)
Selling, general and
administrative expenses
114
297
18
%
637
23
%
(35
%)
859
24
%
(26
%)
Research and development
costs
33
66
4
%
168
6
%
(41
%)
195
5
%
(14
%)
Restructuring costs and other
17
43
3
%
215
8
%
(72
%)
108
3
%
99
%
Other operating expense
(income), net
2
(495
)
21
%
(85
)
3
%
480
%
(56
)
2
%
52
%
(Loss) earnings from
continuing operations
before interest expense,
loss on early
extinguishment of debt,
net, other income
(charges), net,
reorganization items, net
and income taxes
(48
)
457
17
%
(642
)
(24
%)
164
%
(616
)
(17
%)
(4
%)
Interest expense
22
106
5
%
139
5
%
(8
%)
138
4
%
1
%
Loss on early extinguishment
of debt, net
—
8
—
7
—
14
%
—
—
—
Other income (charges), net
12
(13
)
—
21
1
%
(105
%)
(3
)
—
800
%
Reorganization items, net
16
(2,026
)
86
%
843
31
%
(338
%)
—
—
—
(Loss) earnings from
continuing operations
before income taxes
(74
)
2,356
97
%
(1,610
)
(59
%)
242
%
(757
)
(21
%)
(113
%)
Provision (benefit) for income
taxes
8
155
7
%
(273
)
(10
%)
(160
%)
(18
)
(1
%)
1,417
%
(Loss) earnings from
continuing operations
(82
)
2,201
90
%
(1,337
)
(49
%)
258
%
(739
)
(21
%)
(81
%)
Earnings (loss) from
discontinued operations,
net of income taxes
4
(135
)
(6
%)
(42
)
(2
%)
212
%
(25
)
(1
%)
(68
%)
NET (LOSS) EARNINGS
(78
)
2,066
85
%
(1,379
)
(51
%)
244
%
(764
)
(21
%)
(80
%)
Less: Net loss attributable to
noncontrolling interests
3
—
—
—
—
—
—
—
—
NET (LOSS) EARNINGS
ATTRIBUTABLE TO
EASTMAN KODAK
COMPANY
$
(81
)
$
2,066
85
%
$
(1,379
)
(51
%)
244
%
$
(764
)
(21
%)
(80
%)
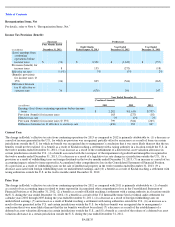
Year Ended December 31,
Percent Change vs. 2012 (Combined)
(in millions)
2013
(Combined)
Amount
Change vs.
2012
(Predecessor)
Volume
Price/Mix
Foreign
Exchange
Manufacturing
and Other
Costs
Net Sales
$
2,347
-
14
%
-
17
%
4
%
-
1
%
n/a
Gross profit margin
21
%
10pp
n/a
8pp
-
1pp
3pp
Year Ended December 31,
Percent Change vs. 2011
(in millions)
2012 Amount
(Predecessor)
Change vs.
2011
(Predecessor)
Volume
Price/Mix
Foreign
Exchange
Manufacturing
and Other
Costs
Net Sales
$
2,719
-
24
%
-
15
%
-
7
%
-
2
%
n/a
Gross profit margin
11
%
-
3pp
n/a
-
2pp
-
1pp
0pp