Kodak 2013 Annual Report Download - page 119
Download and view the complete annual report
Please find page 119 of the 2013 Kodak annual report below. You can navigate through the pages in the report by either clicking on the pages listed below, or by using the keyword search tool below to find specific information within the annual report.-
 1
1 -
2
-
3
-
4
-
5
-
6
-
7
-
8
-
9
-
10
-
11
-
12
-
13
-
14
-
15
-
16
-
17
-
18
-
19
-
20
-
21
-
22
-
23
-
24
-
25
-
26
-
27
-
28
-
29
-
30
-
31
-
32
-
33
-
34
-
35
-
36
-
37
-
38
-
39
-
40
-
41
-
42
-
43
-
44
-
45
-
46
-
47
-
48
-
49
-
50
-
51
-
52
-
53
-
54
-
55
-
56
-
57
-
58
-
59
-
60
-
61
-
62
-
63
-
64
-
65
-
66
-
67
-
68
-
69
-
70
-
71
-
72
-
73
-
74
-
75
-
76
-
77
-
78
-
79
-
80
-
81
-
82
-
83
-
84
-
85
-
86
-
87
-
88
-
89
-
90
-
91
-
92
-
93
-
94
-
95
-
96
-
97
-
98
-
99
-
100
-
101
-
102
-
103
-
104
-
105
-
106
-
107
-
108
-
 109
109 -
 110
110 -
 111
111 -
 112
112 -
 113
113 -
 114
114 -
 115
115 -
 116
116 -
 117
117 -
 118
118 -
 119
119 -
 120
120 -
 121
121 -
 122
122 -
 123
123 -
 124
124 -
 125
125 -
 126
126 -
 127
127 -
 128
128 -
 129
129 -
130
-
131
-
132
-
133
-
134
-
135
-
136
-
137
-
138
-
139
-
140
-
141
-
142
-
143
-
144
-
145
-
146
-
147
-
148
-
149
-
150
-
151
-
152
-
153
-
154
-
155
-
156
-
157
-
158
-
159
-
160
-
161
-
162
-
163
-
164
-
165
-
166
-
167
-
168
-
169
-
170
-
171
-
172
-
173
-
174
-
175
-
176
-
177
-
178
 |
 |

Table of Contents
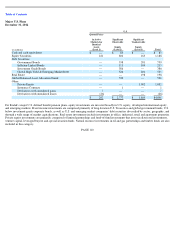
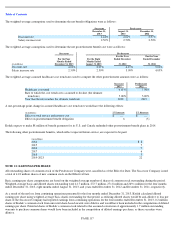
Major Non-U.S. Plans
December 31, 2012
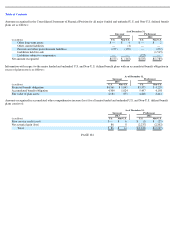
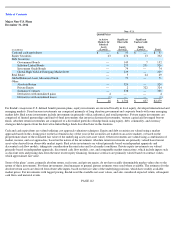
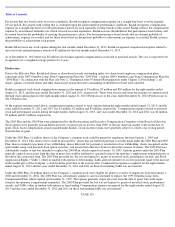
For Kodak’s major non-
U.S. defined benefit pension plans, equity investments are invested broadly in local equity, developed international and
emerging markets. Fixed income investments are comprised primarily of long duration government and corporate bonds with some emerging
market debt. Real estate investments include investments in primarily office, industrial, and retail properties. Private equity investments are
comprised of limited partnerships and fund-of-fund investments that invest in distressed investments, venture capital and leveraged buyout
funds. Absolute return investments are comprised of a diversified portfolio of hedge funds using equity, debt, commodity, and currency
strategies held separate from the derivative-linked hedge funds described later in this footnote.
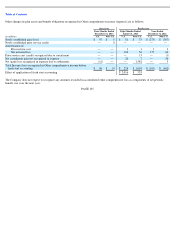
Cash and cash equivalents are valued utilizing cost approach valuation techniques. Equity and debt securities are valued using a market
approach based on the closing price on the last business day of the year (if the securities are traded on an active market), or based on the
proportionate share of the estimated fair value of the underlying assets (net asset value). Other investments are valued using a combination of
market, income, and cost approaches, based on the nature of the investment. Absolute return investments are primarily valued based on net
asset value derived from observable market inputs. Real estate investments are valued primarily based on independent appraisals and
discounted cash flow models, taking into consideration discount rates and local market conditions. Private equity investments are valued
primarily based on independent appraisals, discounted cash flow models, cost, and comparable market transactions, which include inputs such
as discount rates and pricing data from the most recent equity financing. Insurance contracts are primarily valued based on contract values,
which approximate fair value.
Some of the plans’ assets, primarily absolute return, real estate, and private equity, do not have readily determinable market values due to the
nature of these investments. For these investments, fund manager or general partner estimates were used where available. The estimates for the
absolute return assets are derived from observable inputs, based on the fair value of the underlying positions, which have readily available
market prices. For investments with lagged pricing, Kodak used the available net asset values, and also considered expected return, subsequent
cash flows and material events.
PAGE 112
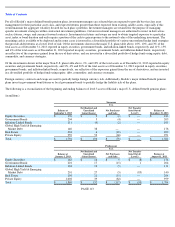
Non
-
U.S.
(in millions)
Quoted Prices
in Active
Markets for
Identical
Assets
(Level 1)
Significant
Observable
Inputs
(Level 2)
Significant
Unobservable
Inputs
(Level 3)
Total
Cash and cash equivalents
$
—
$
57
$
—
$
57
Equity Securities
43
276
13
332
Debt Securities:
Government Bonds
—
145
7
152
Inflation
-
Linked Bonds
—
275
251
526
Investment Grade Bonds
—
74
—
74
Global High Yield & Emerging Market Debt
—
229
—
229
Real Estate
—
5
44
49
Global Balanced Asset Allocation Funds
—
71
—
71
Other:
Absolute Return
—
324
—
324
Private Equity
—
2
322
324
Insurance Contracts
—
338
—
338
Derivatives with unrealized gains
4
—
—
4
Derivatives with unrealized losses
(1
)
—
—
(
1
)
$
46
$
1,796
$
637
$
2,479