Kodak 2013 Annual Report Download - page 78
Download and view the complete annual report
Please find page 78 of the 2013 Kodak annual report below. You can navigate through the pages in the report by either clicking on the pages listed below, or by using the keyword search tool below to find specific information within the annual report.-
 1
1 -
2
-
3
-
4
-
5
-
6
-
7
-
8
-
9
-
10
-
11
-
12
-
13
-
14
-
15
-
16
-
17
-
18
-
19
-
20
-
21
-
22
-
23
-
24
-
25
-
26
-
27
-
28
-
29
-
30
-
31
-
32
-
33
-
34
-
35
-
36
-
37
-
38
-
39
-
40
-
41
-
42
-
43
-
44
-
45
-
46
-
47
-
48
-
49
-
50
-
51
-
52
-
53
-
54
-
55
-
56
-
57
-
58
-
59
-
60
-
61
-
62
-
63
-
64
-
65
-
66
-
67
-
 68
68 -
 69
69 -
 70
70 -
 71
71 -
 72
72 -
 73
73 -
 74
74 -
 75
75 -
 76
76 -
 77
77 -
 78
78 -
 79
79 -
 80
80 -
 81
81 -
 82
82 -
 83
83 -
 84
84 -
 85
85 -
 86
86 -
 87
87 -
 88
88 -
89
-
90
-
91
-
92
-
93
-
94
-
95
-
96
-
97
-
98
-
99
-
100
-
101
-
102
-
103
-
104
-
105
-
106
-
107
-
108
-
109
-
110
-
111
-
112
-
113
-
114
-
115
-
116
-
117
-
118
-
119
-
120
-
121
-
122
-
123
-
124
-
125
-
126
-
127
-
128
-
129
-
130
-
131
-
132
-
133
-
134
-
135
-
136
-
137
-
138
-
139
-
140
-
141
-
142
-
143
-
144
-
145
-
146
-
147
-
148
-
149
-
150
-
151
-
152
-
153
-
154
-
155
-
156
-
157
-
158
-
159
-
160
-
161
-
162
-
163
-
164
-
165
-
166
-
167
-
168
-
169
-
170
-
171
-
172
-
173
-
174
-
175
-
176
-
177
-
178
 |
 |

Table of Contents
The net gain on reorganization adjustments has been included in Reorganization items, net in the Consolidated Statement of Operations.
Fresh Start adjustments
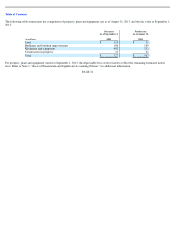
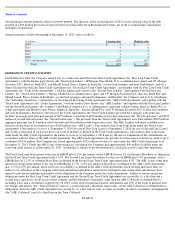
The following table summarizes the components of inventory as of August 31, 2013, and the fair value at September 1, 2013:
PAGE 73
21. An adjustment of $67 million was recorded to increase the net book value of inventories to their estimated fair value, which was
determined as follows:
• Fair value of finished goods inventory were determined based on the estimated selling price less costs to sell including disposal and
holding period costs, and a reasonable profit margin on the selling and disposal effort.
• Fair value of work-in-process was determined based on the estimated selling price once completed less total costs to complete the
manufacturing effort, costs to sell including disposal and holding period costs, and a reasonable profit on the remaining
manufacturing, selling and disposal effort.
•
Fair value of raw materials was determined based on current replacement costs.
Successor
Predecessor
(in millions)
As of September 1,
2013
As of August 31,
2013
Finished goods
$
280
$
235
Work in process
120
99
Raw materials
102
101
Total
$
502
$
435
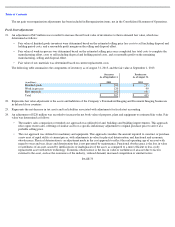
22. Represents fair value adjustment to the assets and liabilities of the Company’s Personalized Imaging and Document Imaging businesses
in delayed close countries.
23.
Represents the net decrease in tax assets and tax liabilities associated with adjustments for fresh start accounting.
24. An adjustment of $220 million was recorded to increase the net book value of property, plant and equipment to estimated fair value. Fair
value was determined as follows:
• The market, sales comparison or trended cost approach was utilized for land, buildings and building improvements. This approach
relies upon recent sales, offerings of similar assets or a specific inflationary adjustment to original purchase price to arrive at a
probable selling price.
•
The cost approach was utilized for machinery and equipment. This approach considers the amount required to construct or purchase
a new asset of equal utility at current prices, with adjustments in value for physical deterioration, and functional and economic
obsolescence. Physical deterioration is an adjustment made in the cost approach to reflect the real operating age of an asset with
regard to wear and tear, decay and deterioration that is not prevented by maintenance. Functional obsolescence is the loss in value
or usefulness of an asset caused by inefficiencies or inadequacies of the asset, as compared to a more efficient or less costly
replacement asset with newer technology. Economic obsolescence is the loss in value or usefulness of an asset due to factors
external to the asset, such as the economics of the industry, reduced demand, increased competition or similar factors.