Kodak 2013 Annual Report Download - page 41
Download and view the complete annual report
Please find page 41 of the 2013 Kodak annual report below. You can navigate through the pages in the report by either clicking on the pages listed below, or by using the keyword search tool below to find specific information within the annual report.-
 1
1 -
2
-
3
-
4
-
5
-
6
-
7
-
8
-
9
-
10
-
11
-
12
-
13
-
14
-
15
-
16
-
17
-
18
-
19
-
20
-
21
-
22
-
23
-
24
-
25
-
26
-
27
-
28
-
29
-
30
-
 31
31 -
 32
32 -
 33
33 -
 34
34 -
 35
35 -
 36
36 -
 37
37 -
 38
38 -
 39
39 -
 40
40 -
 41
41 -
 42
42 -
 43
43 -
 44
44 -
 45
45 -
 46
46 -
 47
47 -
 48
48 -
 49
49 -
 50
50 -
 51
51 -
52
-
53
-
54
-
55
-
56
-
57
-
58
-
59
-
60
-
61
-
62
-
63
-
64
-
65
-
66
-
67
-
68
-
69
-
70
-
71
-
72
-
73
-
74
-
75
-
76
-
77
-
78
-
79
-
80
-
81
-
82
-
83
-
84
-
85
-
86
-
87
-
88
-
89
-
90
-
91
-
92
-
93
-
94
-
95
-
96
-
97
-
98
-
99
-
100
-
101
-
102
-
103
-
104
-
105
-
106
-
107
-
108
-
109
-
110
-
111
-
112
-
113
-
114
-
115
-
116
-
117
-
118
-
119
-
120
-
121
-
122
-
123
-
124
-
125
-
126
-
127
-
128
-
129
-
130
-
131
-
132
-
133
-
134
-
135
-
136
-
137
-
138
-
139
-
140
-
141
-
142
-
143
-
144
-
145
-
146
-
147
-
148
-
149
-
150
-
151
-
152
-
153
-
154
-
155
-
156
-
157
-
158
-
159
-
160
-
161
-
162
-
163
-
164
-
165
-
166
-
167
-
168
-
169
-
170
-
171
-
172
-
173
-
174
-
175
-
176
-
177
-
178
 |
 |

Table of Contents
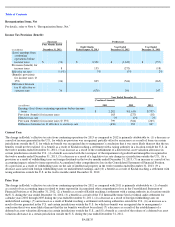
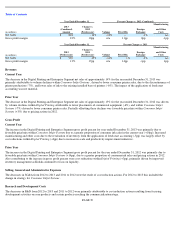
Revenues
Current Year
The decrease in the Digital Printing and Enterprise Segment net sales of approximately 14% for the year ended December 31, 2013 was
primarily attributable to volume declines within Consumer Inkjet Systems
, driven by lower consumer printer sales, due to the discontinuance of
printer production (-7%), and lower sales of ink to the existing installed base of printers (-6%). The impact of the application of fresh start
accounting was not material.
Prior Year
The decrease in the Digital Printing and Enterprise Segment net sales of approximately 15% for the year ended December 31, 2012 was driven
by volume declines within Digital Printing attributable to lower placements of commercial equipment (-6%), and within Consumer Inkjet
Systems (-7%) driven by lower consumer printer sales. Partially offsetting these declines was favorable price/mix within Consumer Inkjet
Systems (+3%) due to pricing actions in 2012.
Gross Profit
Current Year
The increase in the Digital Printing and Enterprise Segment gross profit percent for year ended December 31, 2013 was primarily due to
favorable price/mix within Consumer Inkjet Systems due to a greater proportion of consumer ink sales in the current year (+10pp). Increased
manufacturing and other costs due to the revaluation of inventory from the application of fresh start accounting (-5pp) was largely offset by
cost reductions within Digital Printing (+3pp) due to increase in scale and productivity improvement initiatives.
Prior Year
The increase in the Digital Printing and Enterprise Segment gross profit percent for the year ended December 31, 2012 was primarily due to
favorable price/mix within Consumer Inkjet Systems (+14pp), due to a greater proportion of consumer ink sales and pricing actions in 2012.
Also contributing to the increase in gross profit percent were cost reductions within Digital Printing (+3pp), primarily driven by improved
inventory management as Kodak continued to focus on liquidity.
Selling, General and Administrative Expenses
The decreases in SG&A from 2012 to 2013 and 2011 to 2012 were the result of cost reduction actions. For 2012 to 2013 this included the
change in strategy for Consumer Inkjet Systems .
Research and Development Costs
The decreases in R&D from 2012 to 2013 and 2011 to 2012 were primarily attributable to cost reduction actions resulting from focusing
development activities on core products and certain products reaching the commercialization stage.
PAGE 39
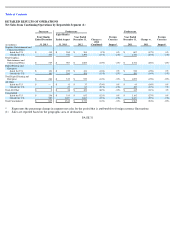
Year Ended December 31,
Percent Change vs. 2012 (Combined)
(in millions)
2013
(Combined)
Amount
Change vs.
2012
(Predecessor)
Volume
Price/Mix
Foreign
Exchange
Manufacturing
and Other
Costs
Net Sales
$
803
-
14
%
-
13
%
—
-
1
%
n/a
Gross profit margin
23
%
10pp
n/a
11pp
0pp
-
1pp
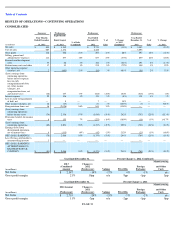
Year Ended December 31,
Percent Change vs. 2011
(in millions)
2012
(Predecessor)
Change vs.
2011
(Predecessor)
Volume
Price/Mix
Foreign
Exchange
Manufacturing
and Other
Costs
Net Sales
$
939
-
15
%
-
14
%
1
%
-
2
%
n/a
Gross profit margin
13
%
17pp
n/a
14pp
-
1pp
4pp