Kodak 2013 Annual Report Download - page 136
Download and view the complete annual report
Please find page 136 of the 2013 Kodak annual report below. You can navigate through the pages in the report by either clicking on the pages listed below, or by using the keyword search tool below to find specific information within the annual report.-
 1
1 -
2
-
3
-
4
-
5
-
6
-
7
-
8
-
9
-
10
-
11
-
12
-
13
-
14
-
15
-
16
-
17
-
18
-
19
-
20
-
21
-
22
-
23
-
24
-
25
-
26
-
27
-
28
-
29
-
30
-
31
-
32
-
33
-
34
-
35
-
36
-
37
-
38
-
39
-
40
-
41
-
42
-
43
-
44
-
45
-
46
-
47
-
48
-
49
-
50
-
51
-
52
-
53
-
54
-
55
-
56
-
57
-
58
-
59
-
60
-
61
-
62
-
63
-
64
-
65
-
66
-
67
-
68
-
69
-
70
-
71
-
72
-
73
-
74
-
75
-
76
-
77
-
78
-
79
-
80
-
81
-
82
-
83
-
84
-
85
-
86
-
87
-
88
-
89
-
90
-
91
-
92
-
93
-
94
-
95
-
96
-
97
-
98
-
99
-
100
-
101
-
102
-
103
-
104
-
105
-
106
-
107
-
108
-
109
-
110
-
111
-
112
-
113
-
114
-
115
-
116
-
117
-
118
-
119
-
120
-
121
-
122
-
123
-
124
-
125
-
 126
126 -
 127
127 -
 128
128 -
 129
129 -
 130
130 -
 131
131 -
 132
132 -
 133
133 -
 134
134 -
 135
135 -
 136
136 -
 137
137 -
 138
138 -
 139
139 -
 140
140 -
 141
141 -
 142
142 -
 143
143 -
 144
144 -
 145
145 -
 146
146 -
147
-
148
-
149
-
150
-
151
-
152
-
153
-
154
-
155
-
156
-
157
-
158
-
159
-
160
-
161
-
162
-
163
-
164
-
165
-
166
-
167
-
168
-
169
-
170
-
171
-
172
-
173
-
174
-
175
-
176
-
177
-
178
 |
 |
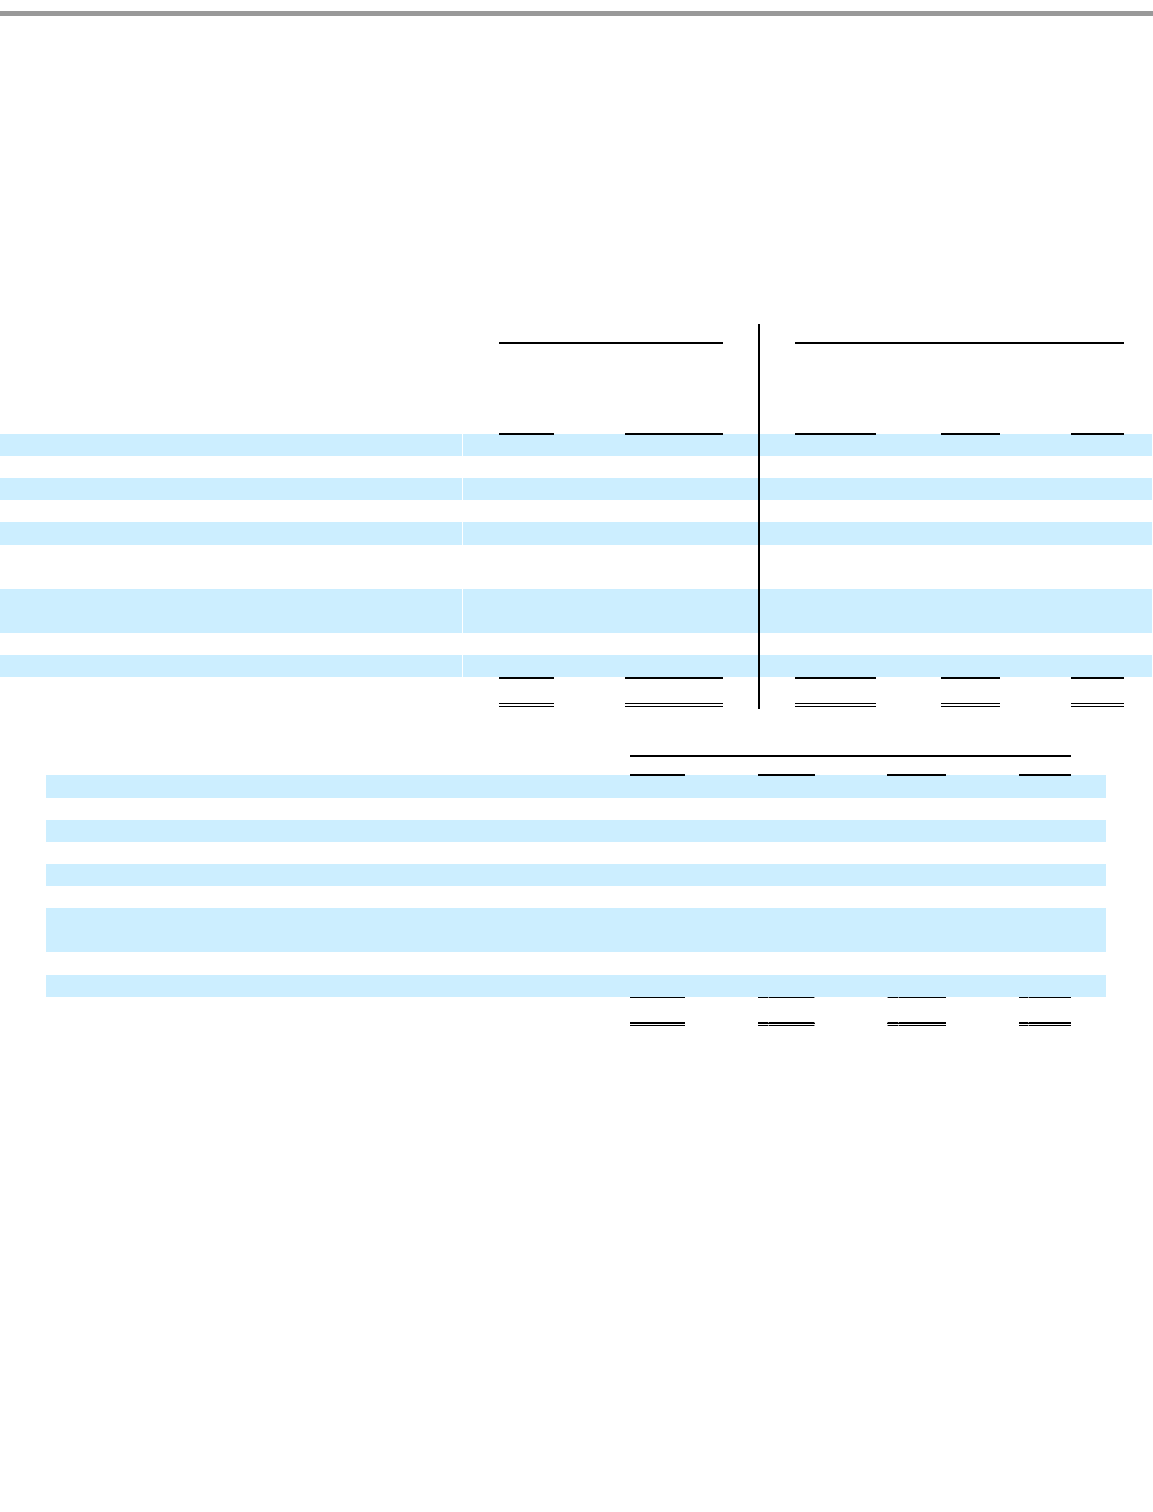
Table of Contents
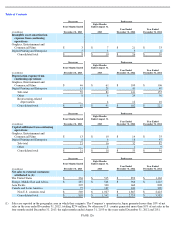
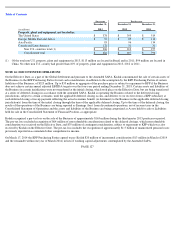
Depreciation and amortization of long-lived assets of the Personalized Imaging and Document Imaging businesses included in discontinued
operations ceased as of July 1, 2013.
Direct operating expenses of the discontinued operations are included in the results of discontinued operations. Indirect expenses that were
historically allocated to the discontinued operations have been included in the results of continuing operations. Prior period results have been
reclassified to conform to the current period presentation.
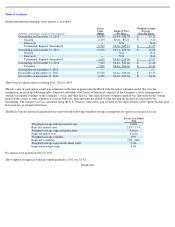
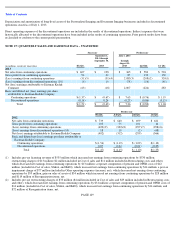
NOTE 27: QUARTERLY SALES AND EARNINGS DATA – UNAUDITED
PAGE 129
Successor
Predecessor
(in millions, except per share data)
4th Qtr.
September 1,
2013 through
September 30,
2013
July 1, 2013
through
August 31,
2013
2nd Qtr.
1st Qtr.
2013
Net sales from continuing operations
$
607
$
198
$
365
$
583
$
594
Gross profit from continuing operations
96
22
85
133
150
(Loss) earnings from continuing operations
(51
)(5)
(31
)(4)
2,085
(3)
(208
)(2)
324
(1)
(Loss) earnings from discontinued operations (10)
(6
)
10
(78
)
(16
)
(41
)
Net (loss) earnings attributable to Eastman Kodak
Company
(63
)
(18
)
2,007
(224
)
283
Basic and diluted net (loss) earnings per share
attributable to Eastman Kodak Company
Continuing operations
$
(1.37
)
$
(0.67
)
$
7.65
$
(0.76
)
$
1.19
Discontinued
operations
(0.14
)
0.24
(0.29
)
(0.06
)
(0.15
)
Total
$
(1.51
)
$
(0.43
)
$
7.36
$
(0.82
)
$
1.04
Predecessor
4th Qtr.
3rd Qtr.
2nd Qtr.
1st Qtr.
2012
Net sales from continuing operations
$
739
$
660
$
699
$
621
Gross profit from continuing operations
103
75
101
14
(Loss) earnings from continuing operations
(420
)(9)
(322
)(8)
(297
)(7)
(298
)(6)
(Loss) earnings from discontinued operations (10)
18
10
(2
)
(68
)
Net (loss) earnings attributable to Eastman Kodak Company
(402
)
(312
)
(299
)
(366
)
Basic and diluted net (loss) earnings per share attributable to
Eastman Kodak Company
Continuing operations
$
(1.54
)
$
(1.19
)
$
(1.09
)
$
(1.10
)
Discontinued operations
0.07
0.04
(0.01
)
(0.25
)
Total
$
(1.47
)
$
(1.15
)
$
(1.10
)
$
(1.35
)
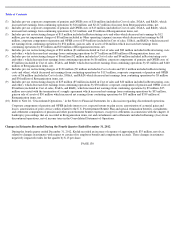
(1) Includes pre-tax licensing revenue of $535 million which increased net earnings from continuing operations by $530 million;
restructuring charges of $13 million ($2 million included in Cost of sales and $11 million included in Restructuring costs and other),
which decreased net earnings from continuing operations by $13 million; corporate components of pension and OPEB costs of $12
million (included in Cost of sales, SG&A, and R&D), which increased net earnings from continuing operations by $14 million; a pre-tax
impairment charge of $77 million (included in Other operating expenses (income), net), which decreased net earnings from continuing
operations by $55 million, gain on sales of assets of $34 million which increased net earnings from continuing operations by $28 million
and $119 million of Reorganization items, net.
(2) Includes pre-
tax restructuring charges of $33 million ($4 million included in Cost of sales and $29 million included in Restructuring costs
and other), which decreased net earnings from continuing operations by $31 million; corporate components of pension and OPEB costs of
$14 million (included in Cost of sales, SG&A, and R&D), which increased net earnings from continuing operations by $14 million; and
$72 million of Reorganization items, net.