Kodak 2013 Annual Report Download - page 33
Download and view the complete annual report
Please find page 33 of the 2013 Kodak annual report below. You can navigate through the pages in the report by either clicking on the pages listed below, or by using the keyword search tool below to find specific information within the annual report.-
 1
1 -
2
-
3
-
4
-
5
-
6
-
7
-
8
-
9
-
10
-
11
-
12
-
13
-
14
-
15
-
16
-
17
-
18
-
19
-
20
-
21
-
22
-
 23
23 -
 24
24 -
 25
25 -
 26
26 -
 27
27 -
 28
28 -
 29
29 -
 30
30 -
 31
31 -
 32
32 -
 33
33 -
 34
34 -
 35
35 -
 36
36 -
 37
37 -
 38
38 -
 39
39 -
 40
40 -
 41
41 -
 42
42 -
 43
43 -
44
-
45
-
46
-
47
-
48
-
49
-
50
-
51
-
52
-
53
-
54
-
55
-
56
-
57
-
58
-
59
-
60
-
61
-
62
-
63
-
64
-
65
-
66
-
67
-
68
-
69
-
70
-
71
-
72
-
73
-
74
-
75
-
76
-
77
-
78
-
79
-
80
-
81
-
82
-
83
-
84
-
85
-
86
-
87
-
88
-
89
-
90
-
91
-
92
-
93
-
94
-
95
-
96
-
97
-
98
-
99
-
100
-
101
-
102
-
103
-
104
-
105
-
106
-
107
-
108
-
109
-
110
-
111
-
112
-
113
-
114
-
115
-
116
-
117
-
118
-
119
-
120
-
121
-
122
-
123
-
124
-
125
-
126
-
127
-
128
-
129
-
130
-
131
-
132
-
133
-
134
-
135
-
136
-
137
-
138
-
139
-
140
-
141
-
142
-
143
-
144
-
145
-
146
-
147
-
148
-
149
-
150
-
151
-
152
-
153
-
154
-
155
-
156
-
157
-
158
-
159
-
160
-
161
-
162
-
163
-
164
-
165
-
166
-
167
-
168
-
169
-
170
-
171
-
172
-
173
-
174
-
175
-
176
-
177
-
178
 |
 |

Table of Contents
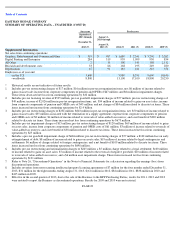
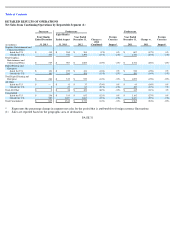
DETAILED RESULTS OF OPERATIONS
Net Sales from Continuing Operations by Reportable Segment (1)
PAGE 31
Successor
Predecessor
Predecessor
(in millions)
Four Months
Ended December
31, 2013
Eight Months
Ended August
31, 2013
Year Ended
December 31,
2012
Change vs.
2012
(Combined)
Foreign
Currency
Impact*
Year Ended
December 31,
2011
Change vs.
2011
Foreign
Currency
Impact*
Graphics, Entertainment and
Commercial Films
Inside the U.S.
$
115
$
265
$
384
(1
%)
0
%
$
607
(37
%)
0
%
Outside the U.S.
404
722
1,296
(13
%)
(2
%)
1,734
(25
%)
(3
%)
Total Graphics,
Entertainment and
Commercial Films
$
519
$
987
$
1,680
(10
%)
(1
%)
$
2,341
(28
%)
(2
%)
Digital Printing and
Enterprise
Inside the U.S.
$
121
$
239
$
431
(16
%)
0
%
$
510
(15
%)
0
%
Outside the U.S.
163
280
508
(13
%)
(2
%)
589
(14
%)
(3
%)
Total Digital Printing and
Enterprise
$
284
$
519
$
939
(14
%)
(1
%)
$
1,099
(15
%)
(2
%)
All Other
Inside the U.S.
$
—
$
11
$
37
(70
%)
0
%
$
45
(18
%)
0
%
Outside the U.S.
2
25
63
(57
%)
(2
%)
100
(37
%)
5
%
Total All Other
$
2
$
36
$
100
(62
%)
(1
%)
$
145
(31
%)
3
%
Consolidated
Inside the U.S.
$
236
$
515
$
852
(12
%)
0
%
$
1,162
(27
%)
0
%
Outside the U.S.
569
1,027
1,867
(15
%)
(2
%)
2,423
(23
%)
(3
%)
Total Consolidated
$
805
$
1,542
$
2,719
(14
%)
(1
%)
$
3,585
(24
%)
(2
%)
*
Represents the percentage change in segment net sales for the period that is attributable to foreign currency fluctuations.
(1)
Sales are reported based on the geographic area of destination.