Kodak 2013 Annual Report Download - page 36
Download and view the complete annual report
Please find page 36 of the 2013 Kodak annual report below. You can navigate through the pages in the report by either clicking on the pages listed below, or by using the keyword search tool below to find specific information within the annual report.-
 1
1 -
2
-
3
-
4
-
5
-
6
-
7
-
8
-
9
-
10
-
11
-
12
-
13
-
14
-
15
-
16
-
17
-
18
-
19
-
20
-
21
-
22
-
23
-
24
-
25
-
 26
26 -
 27
27 -
 28
28 -
 29
29 -
 30
30 -
 31
31 -
 32
32 -
 33
33 -
 34
34 -
 35
35 -
 36
36 -
 37
37 -
 38
38 -
 39
39 -
 40
40 -
 41
41 -
 42
42 -
 43
43 -
 44
44 -
 45
45 -
 46
46 -
47
-
48
-
49
-
50
-
51
-
52
-
53
-
54
-
55
-
56
-
57
-
58
-
59
-
60
-
61
-
62
-
63
-
64
-
65
-
66
-
67
-
68
-
69
-
70
-
71
-
72
-
73
-
74
-
75
-
76
-
77
-
78
-
79
-
80
-
81
-
82
-
83
-
84
-
85
-
86
-
87
-
88
-
89
-
90
-
91
-
92
-
93
-
94
-
95
-
96
-
97
-
98
-
99
-
100
-
101
-
102
-
103
-
104
-
105
-
106
-
107
-
108
-
109
-
110
-
111
-
112
-
113
-
114
-
115
-
116
-
117
-
118
-
119
-
120
-
121
-
122
-
123
-
124
-
125
-
126
-
127
-
128
-
129
-
130
-
131
-
132
-
133
-
134
-
135
-
136
-
137
-
138
-
139
-
140
-
141
-
142
-
143
-
144
-
145
-
146
-
147
-
148
-
149
-
150
-
151
-
152
-
153
-
154
-
155
-
156
-
157
-
158
-
159
-
160
-
161
-
162
-
163
-
164
-
165
-
166
-
167
-
168
-
169
-
170
-
171
-
172
-
173
-
174
-
175
-
176
-
177
-
178
 |
 |

Table of Contents
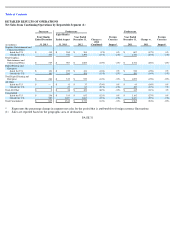
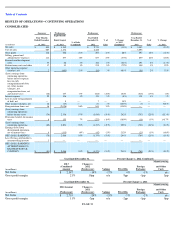
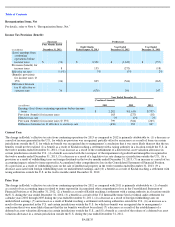
Revenues
Current Year
For the year ended December 31, 2013, net sales decreased approximately 14% compared with the same period in 2012 primarily due to
volume declines in each segment, partially offset by favorable price/mix within Intellectual Property and Brand Licensing (+3%) and
Entertainment Imaging and Commercial Films
(+2%) in the Graphics, Entertainment & Commercial Films Segment. The impact of the
application of fresh start accounting was not material. See segment discussions below for additional information.
Included in revenues were non-recurring intellectual property licensing agreements. Such agreements contributed approximately $38 million to
revenues in 2013. There were no significant non-recurring intellectual property licensing agreements in 2012. However, there was a $61
million license revenue reduction reflecting sharing, with licensees, of the withholding tax refund received in 2012 (refer to Note 17, “Income
Taxes” for additional information).
Prior Year
For the year ended December 31, 2012, net sales decreased approximately 24% compared with the same period in 2011 primarily due to
volume declines across all segments. Also included in the total decline was the $61 million license revenue reduction reflecting sharing, with
licensees, of the withholding tax refund received in the first quarter of 2012 (refer to Note 17, “Income Taxes” for additional information).
Non
-recurring intellectual property licensing agreements contributed $82 million to revenues in 2011. See segment discussion below for
additional information.
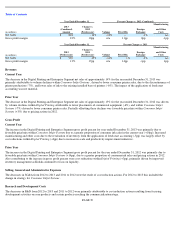
Gross Profit
Current Year
The increase in gross profit percent from 2012 to 2013 was due to favorable price/mix in the Graphics, Entertainment and Commercial Films
Segment (+4pp) primarily from intellectual property licensing and the Digital Printing and Enterprise Segment (+3pp). Also contributing to the
increase was a reduction in pension and other postretirement benefit costs in the current year (+3pp) and other cost improvements from each
segment (+3pp) partially offset by increased manufacturing and other costs due to the revaluation of inventory from the application of fresh
start accounting (-3pp). See segment discussions below for additional details.
Prior Year
The decrease in gross profit percent from 2011 to 2012 was driven by unfavorable price/mix within the Graphics, Entertainment & Commercial
Films Segment (-7pp) primarily attributable to the $61 million licensing revenue reduction as noted above. This was partially offset by
favorable price/mix within the DP&E segment, due to the focus on liquidity within Consumer Inkjet Systems (+4pp). See segment discussions
below for additional details.
Selling, General and Administrative Expenses
The decreases in consolidated selling, general and administrative expenses (SG&A) from 2012 to 2013 and 2011 to 2012 were the result of cost
reduction actions. For 2012 to 2013 this included the change in strategy for Consumer Inkjet Systems .
Research and Development Costs
The decreases in consolidated research and development costs (R&D) from 2012 to 2013 and 2011 to 2012 were primarily attributable to cost
reduction actions resulting from focusing development activities on core products and certain products reaching the commercialization stage.
Restructuring Costs and Other
These costs, as well as the restructuring costs reported in Cost of sales, are discussed under the “RESTRUCTURING COSTS AND OTHER”
section in this MD&A.
Other Operating Expense (Income), Net
For details, refer to Note 15, “Other Operating Expense (Income), Net.”
Other Income (Charges), Net
For details, refer to Note 16, “Other Income (Charges), Net.”
PAGE 34