Hyundai 2014 Annual Report Download - page 83
Download and view the complete annual report
Please find page 83 of the 2014 Hyundai annual report below. You can navigate through the pages in the report by either clicking on the pages listed below, or by using the keyword search tool below to find specific information within the annual report.-
 1
1 -
2
-
3
-
4
-
5
-
6
-
7
-
8
-
9
-
10
-
11
-
12
-
13
-
14
-
15
-
16
-
17
-
18
-
19
-
20
-
21
-
22
-
23
-
24
-
25
-
26
-
27
-
28
-
29
-
30
-
31
-
32
-
33
-
34
-
35
-
36
-
37
-
38
-
39
-
40
-
41
-
42
-
43
-
44
-
45
-
46
-
47
-
48
-
49
-
50
-
51
-
52
-
53
-
54
-
55
-
56
-
57
-
58
-
59
-
60
-
61
-
62
-
63
-
64
-
65
-
66
-
67
-
68
-
69
-
70
-
71
-
72
-
 73
73 -
 74
74 -
 75
75 -
 76
76 -
 77
77 -
 78
78 -
 79
79 -
 80
80 -
 81
81 -
 82
82 -
 83
83 -
 84
84 -
 85
85 -
 86
86
 |
 |

HYUNDAI MOTOR COMPANY Annual Report 2014
FINANCIAL STATEMENTS / 165164
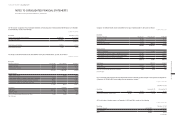
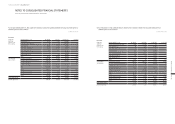
(3) Assets and liabilities by operating segments for the years ended December 31, 2014 and 2013, are as follows:
In millions of Korean Won
For the year ended December 31, 2014
Vehicle Finance Others
Consolidation
adjustments Total
Total assets ₩ 85,791,905 ₩ 65,894,361 ₩ 7,035,554 ₩ (11,496,703) ₩ 147,225,117
Total liabilities 30,424,220 56,783,188 4,162,456 (6,765,312) 84,604,552
Borrowings and debentures 4,393,547 49,644,731 2,142,616 (1,922,962) 54,257,932
In millions of Korean Won
For the year ended December 31, 2013
Vehicle Finance Others
Consolidation
adjustments Total
Total assets ₩ 80,927,475 ₩ 59,157,882 ₩ 6,496,797 ₩ (13,160,675) ₩ 133,421,479
Total liabilities 29,481,884 51,055,240 3,724,238 (7,422,672) 76,838,690
Borrowings and debentures 4,425,746 44,561,579 1,738,408 (2,758,871) 47,966,862
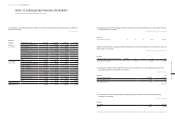
(4) Sales by region where the Group’s entities are located in for the years ended December 31, 2014 and 2013, are as follows:
In millions of Korean Won
For the year ended December 31, 2014
Korea
North
America Asia Europe Others
Consolidation
adjustments Total
Total sales ₩ 54,344,055 ₩ 33,998,857 ₩ 6,732,058 ₩ 26,488,776 ₩ 2,473,365 ₩ (34,780,792) ₩ 89,256,319
Inter-company sales (14,443,717) (7,185,075) (562,985) (12,584,985) (4,030) 34,780,792 -
Net sales 39,900,338 26,813,782 6,169,073 13,903,791 2,469,335 -89,256,319
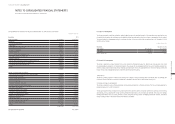
In millions of Korean Won
For the year ended December 31, 2013
Korea
North
America Asia Europe Others
Consolidation
adjustments Total
Total sales ₩ 53,151,843 ₩ 32,764,610 ₩ 7,156,618 ₩ 24,965,678 ₩ 2,384,383 ₩ (33,115,496) ₩ 87,307,636
Inter-company sales (14,386,591) (7,117,997) (720,235) (10,890,673) -33,115,496 -
Net sales 38,765,252 25,646,613 6,436,383 14,075,005 2,384,383 -87,307,636
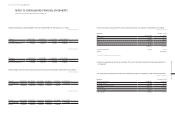
(5) Non-current assets by region where the Group’s entities are located in as of December 31, 2014 and 2013, are as follows:
In millions of Korean Won
Description December 31, 2014 December 31, 2013
Korea ₩ 21,109,314 ₩ 19,428,529
North America 2,174,461 1,882,933
Asia 1,129,741 1,057,874
Europe 1,952,153 2,080,979
Others 399,453 456,797
26,765,122 24,907,112
Consolidation adjustments (79,000) (51,451)
Total (*) ₩ 26,686,122 ₩ 24,855,661
(*) Sum of PP&E, intangible assets and investment property.
(6) There is no single external customer who represents 10% or more of the Group’s revenue for the years ended December 31,
2014 and 2013.
39. CONSTRUCTION CONTRACTS:
Cost, income and loss and claimed construction from construction in progress as of December 31, 2014, and 2013 are as follows:
In millions of Korean Won
Description December 31, 2014 December 31, 2013
Accumulated accrual cost ₩ 7,427,961 ₩ 6,201,961
Accumulated income 1,071,348 739,304
Accumulated construction in process 8,499,309 6,941,265
Progress billing (7,172,915) (5,993,002)
Due from customers 1,617,221 1,393,555
Due to customers (290,827) (445,292)
NOTES TO CONSOLIDATED FINANCIAL STATEMENTS
AS OF AND FOR THE YEARS ENDED DECEMBER 31, 2014 AND 2013