Hyundai 2014 Annual Report Download - page 77
Download and view the complete annual report
Please find page 77 of the 2014 Hyundai annual report below. You can navigate through the pages in the report by either clicking on the pages listed below, or by using the keyword search tool below to find specific information within the annual report.-
 1
1 -
2
-
3
-
4
-
5
-
6
-
7
-
8
-
9
-
10
-
11
-
12
-
13
-
14
-
15
-
16
-
17
-
18
-
19
-
20
-
21
-
22
-
23
-
24
-
25
-
26
-
27
-
28
-
29
-
30
-
31
-
32
-
33
-
34
-
35
-
36
-
37
-
38
-
39
-
40
-
41
-
42
-
43
-
44
-
45
-
46
-
47
-
48
-
49
-
50
-
51
-
52
-
53
-
54
-
55
-
56
-
57
-
58
-
59
-
60
-
61
-
62
-
63
-
64
-
65
-
66
-
 67
67 -
 68
68 -
 69
69 -
 70
70 -
 71
71 -
 72
72 -
 73
73 -
 74
74 -
 75
75 -
 76
76 -
 77
77 -
 78
78 -
 79
79 -
 80
80 -
 81
81 -
 82
82 -
 83
83 -
 84
84 -
 85
85 -
 86
86
 |
 |

HYUNDAI MOTOR COMPANY Annual Report 2014
FINANCIAL STATEMENTS / 153152
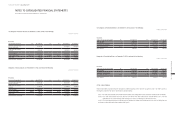
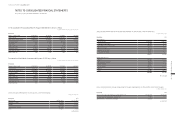
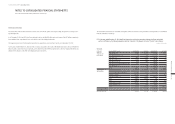
34. CASH GENERATED FROM OPERATIONS:
Cash generated from operations for the years ended December 31, 2014 and 2013, is as follows:
In millions of Korean Won
Description 2014 2013
Profit for the year ₩ 7,649,468 ₩ 8,993,497
Adjustments:
Post-employment benefits 470,016 527,620
Depreciation 1,843,802 1,768,985
Amortization of intangible assets 706,095 782,353
Provision for warranties 866,416 773,917
Income tax expense 2,301,806 2,703,209
Loss on foreign currency translation, net 242,779 53,397
Loss (gain) on disposals of PP&E, net 22,455 (70,363)
Interest income, net (352,176) (240,196)
Gain on share of earnings of equity-accounted investees, net (2,402,979) (2,748,647)
Gain on disposals of investments in associates, net (13,367) (308,462)
Cost of sales from financial services, net 4,338,252 3,849,325
Others 346,557 241,641
8,369,656 7,332,779
Changes in operating assets and liabilities:
Decrease (increase) in trade notes and accounts receivable (614,041) 195,459
Increase in other receivables (213,459) (376,285)
Increase in other financial assets (1,680,932) (364,928)
Increase in inventories (804,120) (828,298)
Decrease (increase) in other assets (12,947) 131,150
Increase in trade notes and accounts payable 824,354 150,460
Decrease in other payables (167,667) (455,914)
Increase (decrease) in other liabilities 227,641 (981,317)
Decrease in other financial liabilities (23,610) (15,784)
Changes in net defined benefit liabilities (723,804) (588,056)
Payment of severance benefits (52,124) (39,831)
Decrease in provisions (1,345,291) (1,206,421)
Changes in financial services receivables (3,639,876) (4,034,164)
Increase in operating lease assets (4,267,094) (4,737,714)
Others 71,821 (65,590)
(12,421,149) (13,217,233)
Cash generated from operations ₩ 3,597,975 ₩ 3,109,043
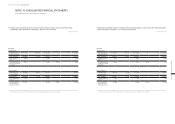
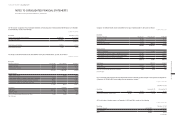
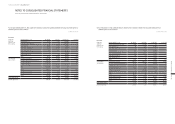
35. RISK MANAGEMENT:
(1) Capital risk management
The Group manages its capital to maintain an optimal capital structure for maximizing profit of its shareholder and reducing the cost
of capital. Debt to equity ratio calculated as total liabilities divided by total equity is used as an index to manage the Group’s capital.
The overall capital risk management policy is consistent with that of the prior period. Debt to equity ratios as of December 31, 2014
and 2013, are as follows:
In millions of Korean Won
Description December 31, 2014 December 31, 2013
Total liabilities ₩ 84,604,552 ₩ 76,838,690
Total equity 62,620,565 56,582,789
Debt-to-equity ratio 135.1% 135.8%
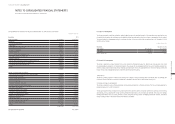
(2) Financial risk management
The Group is exposed to various financial risks such as market risk (foreign exchange risk, interest rate risk and price risk), credit
risk and liquidity risk related to its financial instruments. The purpose of risk management of the Group is to identify potential risks
related to financial performance and reduce, eliminate and evade those risks to an acceptable level of risks to the Group. Overall, the
Group’s financial risk management policy is consistent with the prior period policy.
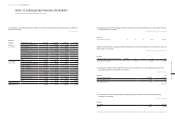
1) Market risk
The Group is mainly exposed to financial risks arising from changes in foreign exchange rates and interest rates. Accordingly, the
Group uses financial derivative contracts to hedge and to manage its interest rate risk and foreign currency risk.
a) Foreign exchange risk management
The Group is exposed to various foreign exchange risks by making transactions in foreign currencies. The Group is mainly exposed to
foreign exchange risk in USD, EUR and JPY.
The Group manages foreign exchange risk by matching the inflow and the outflow of foreign currencies according to each currency
and maturity, and by adjusting the foreign currency settlement date based on its exchange rate forecast. The Group uses foreign
exchange derivatives; such as currency forward, currency swap, and currency option; as hedging instruments. However, speculative
foreign exchange trade on derivative financial instruments is prohibited.
NOTES TO CONSOLIDATED FINANCIAL STATEMENTS
AS OF AND FOR THE YEARS ENDED DECEMBER 31, 2014 AND 2013