Hyundai 2014 Annual Report Download - page 67
Download and view the complete annual report
Please find page 67 of the 2014 Hyundai annual report below. You can navigate through the pages in the report by either clicking on the pages listed below, or by using the keyword search tool below to find specific information within the annual report.-
 1
1 -
2
-
3
-
4
-
5
-
6
-
7
-
8
-
9
-
10
-
11
-
12
-
13
-
14
-
15
-
16
-
17
-
18
-
19
-
20
-
21
-
22
-
23
-
24
-
25
-
26
-
27
-
28
-
29
-
30
-
31
-
32
-
33
-
34
-
35
-
36
-
37
-
38
-
39
-
40
-
41
-
42
-
43
-
44
-
45
-
46
-
47
-
48
-
49
-
50
-
51
-
52
-
53
-
54
-
55
-
56
-
 57
57 -
 58
58 -
 59
59 -
 60
60 -
 61
61 -
 62
62 -
 63
63 -
 64
64 -
 65
65 -
 66
66 -
 67
67 -
 68
68 -
 69
69 -
 70
70 -
 71
71 -
 72
72 -
 73
73 -
 74
74 -
 75
75 -
 76
76 -
 77
77 -
78
-
79
-
80
-
81
-
82
-
83
-
84
-
85
-
86
 |
 |
HYUNDAI MOTOR COMPANY Annual Report 2014
FINANCIAL STATEMENTS / 133132
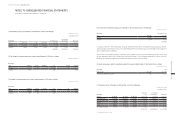
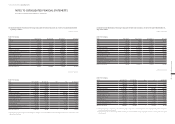
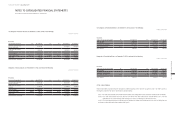
19. FINANCIAL INSTRUMENTS:
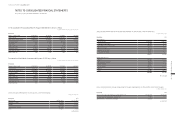
(1) Categories of financial assets as of December 31, 2014, consist of the following:
In millions of Korean Won
Description
Financial
assets at
FVTPL
Loans and
receivables
AFS financial
assets
Derivatives
designated
as hedging
instruments Book value Fair value
Cash and cash equivalents ₩ - ₩ 7,096,513 ₩ - ₩ - ₩ 7,096,513 ₩ 7,096,513
Short-term and long-term
financial instruments -4,101,550 - - 4,101,550 4,101,550
Trade notes and accounts
receivable -3,801,626 - - 3,801,626 3,801,626
Other receivables - 3,143,926 - - 3,143,926 3,143,926
Other financial assets 14,857,723 241,762 2,266,066 39,002 17,404,553 17,404,553
Other assets - 434,481 - - 434,481 434,481
Financial services receivables - 43,994,588 - - 43,994,588 44,292,330
₩ 14,857,723 ₩ 62,814,446 ₩ 2,266,066 ₩ 39,002 ₩ 79,977,237 ₩ 80,274,979
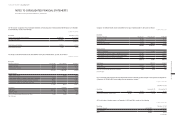
Categories of financial assets as of December 31, 2013, consisted of the following:
In millions of Korean Won
Description
Financial
assets at
FVTPL
Loans and
receivables
AFS financial
assets
Derivatives
designated
as hedging
instruments Book value Fair value
Cash and cash equivalents ₩ - ₩ 6,872,430 ₩ - ₩ - ₩ 6,872,430 ₩ 6,872,430
Short-term and long-term
financial instruments - 14,910,783 - - 14,910,783 14,910,783
Trade notes and accounts
receivable - 3,528,654 - - 3,528,654 3,528,654
Other receivables - 2,845,387 - - 2,845,387 2,845,387
Other financial assets 448,892 248,721 2,515,396 26,696 3,239,705 3,239,705
Other assets - 363,352 - - 363,352 363,352
Financial services receivables - 41,013,607 - - 41,013,607 41,566,247
₩ 448,892 ₩ 69,782,934 ₩ 2,515,396 ₩ 26,696 ₩ 72,773,918 ₩ 73,326,558
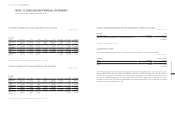
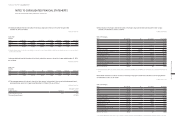
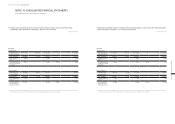
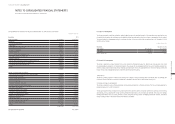
(2) Categories of financial liabilities as of December 31, 2014, consist of the following:
In millions of Korean Won
Description
Financial
liabilities at
FVTPL
Financial
liabilities carried at
amortized cost
Derivatives
designated
as hedging
instruments Book value Fair value
Trade notes and accounts payable ₩ - ₩ 7,041,529 ₩ - ₩ 7,041,529 ₩ 7,041,529
Other payables - 4,688,812 -4,688,812 4,688,812
Borrowings and debentures - 54,257,932 -54,257,932 55,033,485
Other financial liabilities 10,331 9,471 414,029 433,831 433,831
Other liabilities - 1,954,335 -1,954,335 1,954,335
₩ 10,331 ₩ 67,952,079 ₩ 414,029 ₩ 68,376,439 ₩ 69,151,992
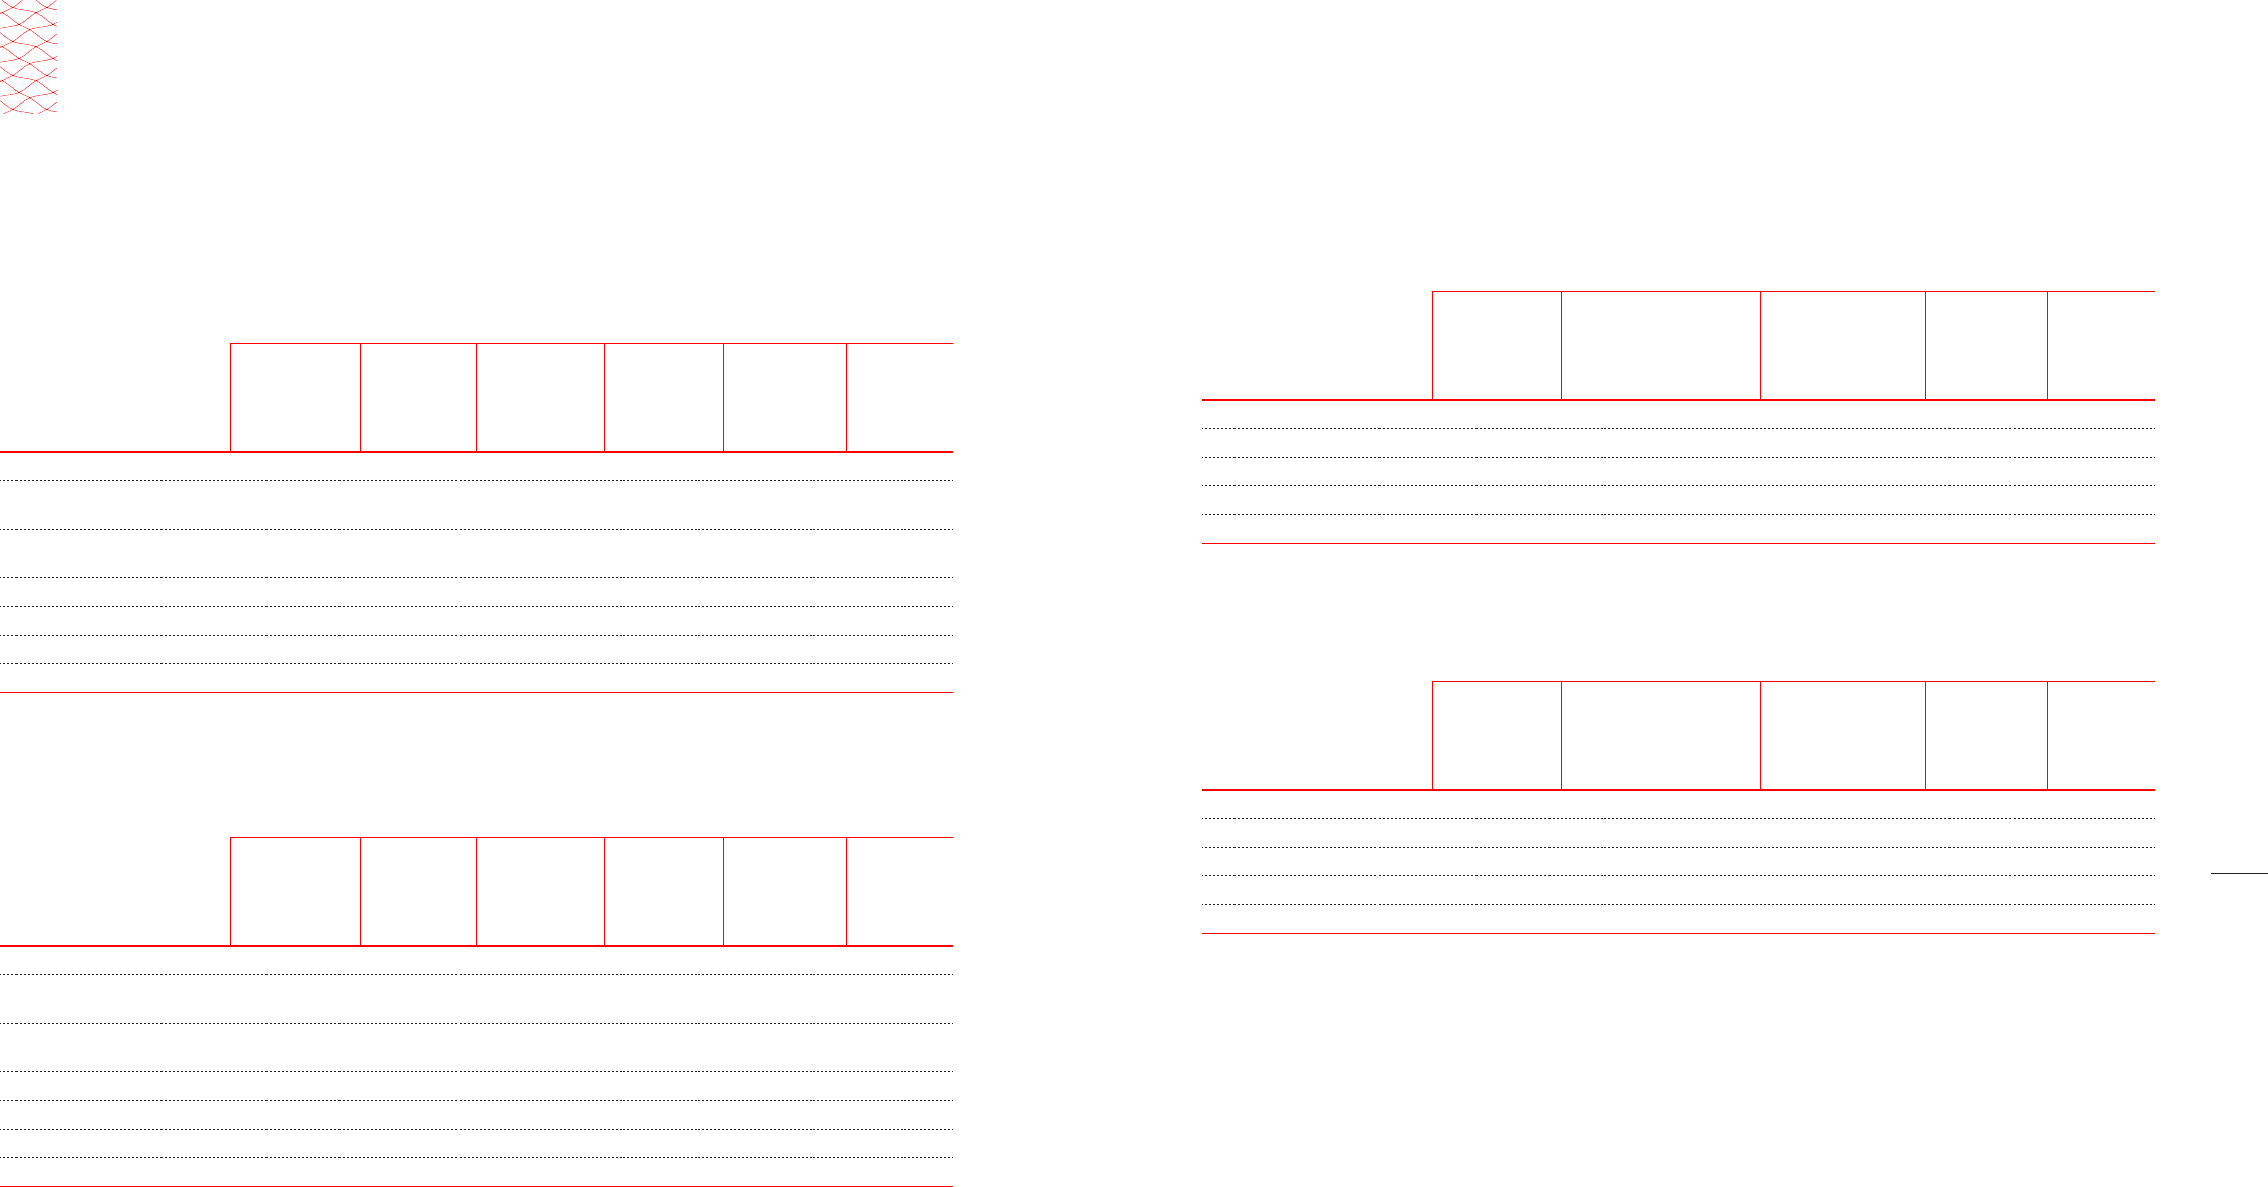
Categories of financial liabilities as of December 31, 2013, consisted of the following:
In millions of Korean Won
Description
Financial
liabilities at
FVTPL
Financial
liabilities carried at
amortized cost
Derivatives
designated
as hedging
instruments Book value Fair value
Trade notes and accounts payable ₩ - ₩ 6,722,740 ₩ - ₩ 6,722,740 ₩ 6,722,740
Other payables - 4,703,454 -4,703,454 4,703,454
Borrowings and debentures - 47,966,862 -47,966,862 48,636,232
Other financial liabilities 3,063 19,711 561,408 584,182 584,182
Other liabilities - 1,664,019 -1,664,019 1,664,019
₩ 3,063 ₩ 61,076,786 ₩ 561,408 ₩ 61,641,257 ₩ 62,310,627
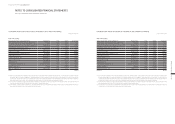
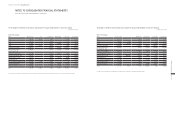
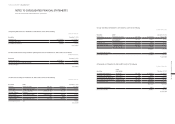
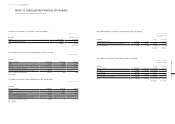
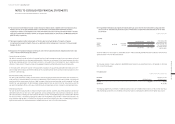
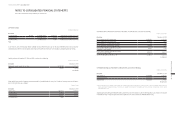
(3) Fair value estimation
Financial instruments that are measured subsequent to initial recognition at fair value are grouped into Level 1 to Level 3, based on
the degree to which the fair value is observable, as described below:
■ Level 1 : Fair value measurements are those derived from quoted prices (unadjusted) in active markets for identical assets or liabilities.
■ Level 2 : Fair value measurements are those derived from inputs other than quoted prices included within Level 1 that are
observable for the asset or liability, either directly (i.e. as prices) or indirectly (i.e. derived from prices).
■
Level 3 : Fair value measurements are those derived from valuation techniques that include inputs for the asset or liability that are
not based on observable market data (unobservable inputs).
NOTES TO CONSOLIDATED FINANCIAL STATEMENTS
AS OF AND FOR THE YEARS ENDED DECEMBER 31, 2014 AND 2013