Hyundai 2014 Annual Report Download - page 42
Download and view the complete annual report
Please find page 42 of the 2014 Hyundai annual report below. You can navigate through the pages in the report by either clicking on the pages listed below, or by using the keyword search tool below to find specific information within the annual report.-
 1
1 -
2
-
3
-
4
-
5
-
6
-
7
-
8
-
9
-
10
-
11
-
12
-
13
-
14
-
15
-
16
-
17
-
18
-
19
-
20
-
21
-
22
-
23
-
24
-
25
-
26
-
27
-
28
-
29
-
30
-
31
-
 32
32 -
 33
33 -
 34
34 -
 35
35 -
 36
36 -
 37
37 -
 38
38 -
 39
39 -
 40
40 -
 41
41 -
 42
42 -
 43
43 -
 44
44 -
 45
45 -
 46
46 -
 47
47 -
 48
48 -
 49
49 -
 50
50 -
 51
51 -
 52
52 -
53
-
54
-
55
-
56
-
57
-
58
-
59
-
60
-
61
-
62
-
63
-
64
-
65
-
66
-
67
-
68
-
69
-
70
-
71
-
72
-
73
-
74
-
75
-
76
-
77
-
78
-
79
-
80
-
81
-
82
-
83
-
84
-
85
-
86
 |
 |

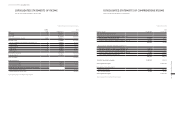
HYUNDAI MOTOR COMPANY Annual Report 2014
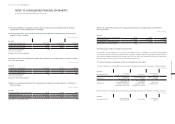
FINANCIAL STATEMENTS / 8382
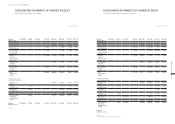
Capital
stock
Capital
surplus
Other
capital items
Accumulated
other
comprehensive
income
Retained
earnings
Total equity
attributable
to the
owners
of the
Company
Non-
controlling
interests
Total
equity
Balance at
January 1, 2013
₩1,488,993 4,158,988 (1,128,779) (473,373) 39,993,230 44,039,059 3,878,516 47,917,575
Comprehensive income :
Profit for the year - - - - 8,541,834 8,541,834 451,663 8,993,497
Gain on AFS
financial assets, net
- - - 58,197 -58,197 958 59,155
Gain on valuation of
cash flow hedge
derivatives, net
- - - 2,319 -2,319 3,944 6,263
Changes in
valuation of
equity-accounted
investees, net
- - - (61,148) 13,206 (47,942) 402 (47,540)
Remeasurements
of defined
benefit plans
- - - - 247,548 247,548 2,242 249,790
Loss on foreign
operations
translation, net
- - - (360,031) -(360,031) (23,278) (383,309)
Total
comprehensive
income
- - - (360,663) 8,802,588 8,441,925 435,931 8,877,856
Transactions with owners,
recorded directly in equity :
Payment of cash
dividends
- - - - (520,832) (520,832) (111,697) (632,529)
Increase in
subsidiaries’ stock
-25,279 - - - 25,279 571,225 596,504
Purchases of
subsidiaries’ stock
-(53,599) - - - (53,599) (121,676) (175,275)
Others - - - - (747) (747) (595) (1,342)
Total transactions
with owners,
recorded directly
in equity
-(28,320) - - (521,579) (549,899) 337,257 (212,642)
Balance at
December 31, 2013
₩1,488,993 4,130,668 (1,128,779) (834,036) 48,274,239 51,931,085 4,651,704 56,582,789
(Continued)
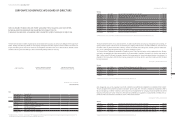
CONSOLIDATED STATEMENTS OF CHANGES IN EQUITY
FOR THE YEARS ENDED DECEMBER 31, 2014 AND 2013
Capital
stock
Capital
surplus
Other
capital items
Accumulated
other
comprehensive
income
Retained
earnings
Total equity
attributable
to the
owners
of the
Company
Non-
controlling
interests
Total
equity
Balance at
January 1, 2014
₩1,488,993 4,130,668 (1,128,779) (834,036) 48,274,239 51,931,085 4,651,704 56,582,789
Comprehensive income :
Profit for the year - - - - 7,346,807 7,346,807 302,661 7,649,468
Gain (loss) on AFS
financial assets, net
- - - (227,394) -(227,394) 1,783 (225,611)
Loss on valuation
of cash flow hedge
derivatives, net
- - - (31,570) -(31,570) (31,182) (62,752)
Changes in
valuation of
equity-accounted
investees, net
- - - 80,124 (82,103) (1,979) 174 (1,805)
Remeasurements
of defined
benefit plans
- - - - (348,491) (348,491) (30,571) (379,062)
Loss on foreign
operations
translation, net
- - - (331,950) -(331,950) (47,807) (379,757)
Total
comprehensive
income
- - - (510,790) 6,916,213 6,405,423 195,058 6,600,481
Transactions with owners,
recorded directly in equity :
Payment of cash
dividends
- - - - (534,409) (534,409) (52,519) (586,928)
Increase in
subsidiaries’ stock
-(952) - - - (952) 148,659 147,707
Purchases of
subsidiaries’ stock
-- - - - - 5,649 5,649
Disposals of
subsidiaries’ stock
-4,834 - - - 4,834 16,909 21,743
Purchases of
treasury stock
- - (144,973) - - (144,973) -(144,973)
Others - - - - (6,180) (6,180) 277 (5,903)
Total transactions
with owners,
recorded directly
in equity
-3,882 (144,973) -(540,589) (681,680) 118,975 (562,705)
Balance at
December 31, 2014
₩ 1,488,993 4,134,550 (1,273,752) (1,344,826) 54,649,863 57,654,828 4,965,737 62,620,565
(Concluded)
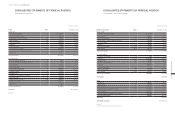
See accompanying notes to consolidated financial statements
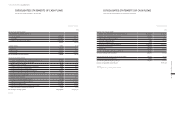
In millions of Korean Won In millions of Korean Won
CONSOLIDATED STATEMENTS OF CHANGES IN EQUITY
FOR THE YEARS ENDED DECEMBER 31, 2014 AND 2013 (CONTINUED)