Hyundai 2014 Annual Report Download - page 45
Download and view the complete annual report
Please find page 45 of the 2014 Hyundai annual report below. You can navigate through the pages in the report by either clicking on the pages listed below, or by using the keyword search tool below to find specific information within the annual report.-
 1
1 -
2
-
3
-
4
-
5
-
6
-
7
-
8
-
9
-
10
-
11
-
12
-
13
-
14
-
15
-
16
-
17
-
18
-
19
-
20
-
21
-
22
-
23
-
24
-
25
-
26
-
27
-
28
-
29
-
30
-
31
-
32
-
33
-
34
-
 35
35 -
 36
36 -
 37
37 -
 38
38 -
 39
39 -
 40
40 -
 41
41 -
 42
42 -
 43
43 -
 44
44 -
 45
45 -
 46
46 -
 47
47 -
 48
48 -
 49
49 -
 50
50 -
 51
51 -
 52
52 -
 53
53 -
 54
54 -
 55
55 -
56
-
57
-
58
-
59
-
60
-
61
-
62
-
63
-
64
-
65
-
66
-
67
-
68
-
69
-
70
-
71
-
72
-
73
-
74
-
75
-
76
-
77
-
78
-
79
-
80
-
81
-
82
-
83
-
84
-
85
-
86
 |
 |
HYUNDAI MOTOR COMPANY Annual Report 2014
FINANCIAL STATEMENTS / 8988
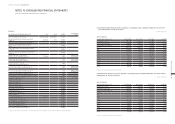
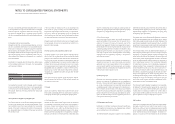
Subsidiaries
Nature of
the business Location
Ownership
percentage
Indirect
ownership
Hyundai Rotem Brasil Engineering Services LTD Sales Brazil 100.00% Hyundai Rotem
100.00%
China Millennium Corporations (CMEs) Holding company Cayman Islands 59.60%
KyoboAXA Private Tomorrow Securities Investment
Trust No.12 Investment Korea 100.00%
Shinyoung Private Securities Investment Trust WB-1 ˝ ˝ 100.00%
UBS Hana Dynamic Balance Private Investment
Trust 1 ˝ ˝ 100.00%
Shinhan BNPP Private Corporate Security Investment
Trust No.34 ˝ ˝ 100.00%
Miraeasset Triumph Private Equity Security Investment
Trust No.15 ˝ ˝ 100.00%
Autopia Forty-Third ~ Forty-Seventh
Asset Securitization Specialty Company (*) Financing ˝0.90% Hyundai Capital
Services 0.90%
Autopia Forty-Ninth ~ Fifty-Second
Asset Securitization Specialty Company (*) ˝ ˝ 0.50% Hyundai Capital
Services 0.50%
Autopia Fifty-Fourth ~ Fifty-five
Asset Securitization Specialty Company (*) ˝ ˝ 0.50% ˝
HB the Third Securitization Specialty Company (*) ˝ ˝ 0.90% Hyundai Capital
Services 0.90%
HB the Fourth Securitization Specialty Company (*) ˝ ˝ 0.31% Hyundai Capital
Services 0.31%
Privia the Third Securitization Specialty Co., Ltd. (*) ˝ ˝ 0.90% Hyundai Card 0.90%
Privia the Fourth ~ Fifth Securitization Specialty Co., Ltd. (*) ˝ ˝ 0.50% Hyundai Card 0.50%
Hyundai CHA Funding Corporation ˝USA 100.00% HCA 100.00%
Hyundai Lease Titling Trust ˝ ˝ 100.00% ˝
Hyundai HK Funding, LLC ˝ ˝ 100.00% ˝
Hyundai HK Funding Two, LLC ˝ ˝ 100.00% ˝
Hyundai HK Funding Three, LLC ˝ ˝ 100.00% ˝
Hyundai ABS Funding Corporation ˝ ˝ 100.00% ˝
HK Real Properties, LLC ˝ ˝ 100.00% ˝
Hyundai Auto Lease Offering, LLC ˝ ˝ 100.00% ˝
Hyundai HK Lease, LLC ˝ ˝ 100.00% ˝
Hyundai Protection Plan, Inc. Insurance ˝100.00% ˝
Hyundai Protection Plan Florida, Inc. ˝ ˝ 100.00% ˝
Hyundai Capital Insurance Services, LLC ˝ ˝ 100.00% ˝
Hyundai Capital Insurance Company ˝ ˝ 100.00% ˝
Power Protect Extended Services, Inc. ˝ ˝ 100.00% ˝
Power Protect Extended Services Florida, Inc. ˝ ˝ 100.00% ˝
(*) The Group is considered to have substantial control over the entities by virtue of an agreement with other investors or relationship with structured entities.
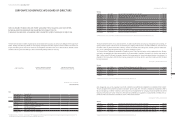
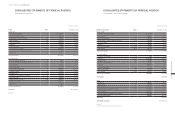
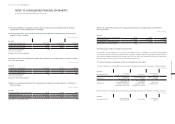
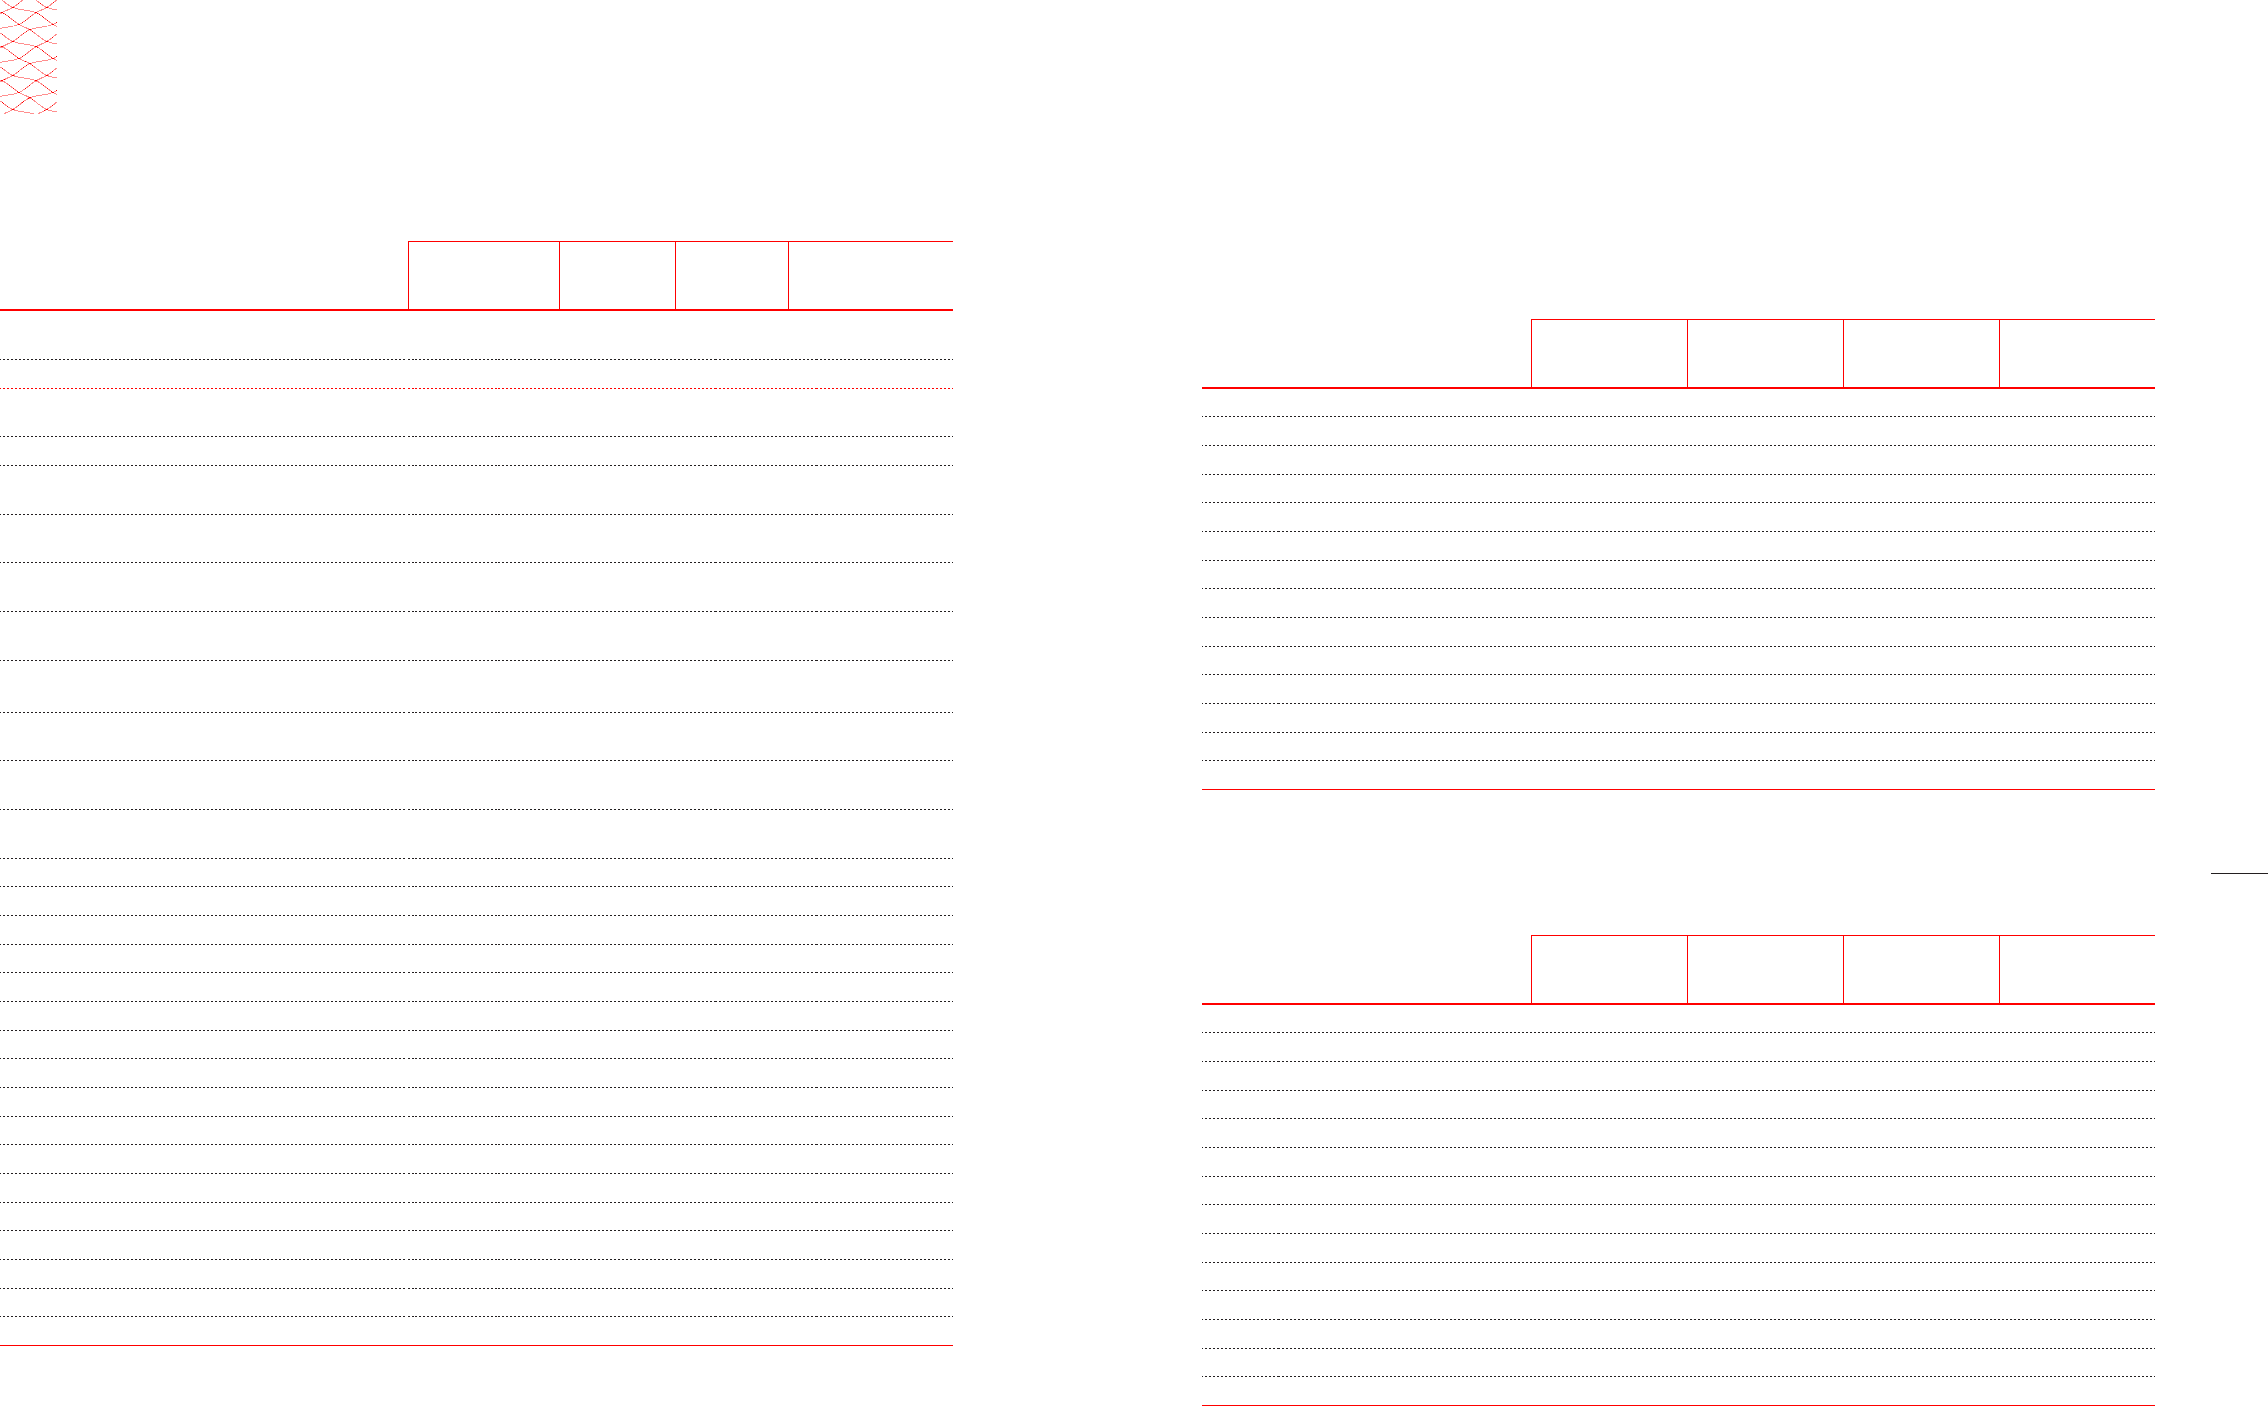
(2) Condensed financial position and results of operations of the Company’s major consolidated subsidiaries as of and for the
year ended December 31, 2014, are as follows:
NOTES TO CONSOLIDATED FINANCIAL STATEMENTS
AS OF AND FOR THE YEARS ENDED DECEMBER 31, 2014 AND 2013
Name of subsidiaries Assets Liabilities Sales
Profit (loss)
for the year
Hyundai Capital Services, Inc. (*) ₩ 22,538,708 ₩ 19,101,141 ₩ 3,011,804 ₩ 237,705
Hyundai Card Co., Ltd. (*) 12,397,420 9,842,039 2,617,995 223,514
Hyundai Rotem Company (*) 4,400,828 2,662,157 3,191,088 (15,109)
Hyundai KEFICO Corporation (*) 1,054,525 557,785 1,741,520 81,572
HCA (*) 30,361,736 27,835,212 5,342,308 266,867
HMA 6,516,465 3,795,729 16,812,738 378,405
HMMA 3,306,417 1,394,335 7,436,941 362,485
HMMC 3,241,318 1,646,741 5,397,857 440,955
HMI (*) 2,115,173 1,029,825 4,636,707 200,999
HME (*) 1,298,995 1,292,923 6,734,387 (38,666)
HAC (*) 998,306 538,314 2,939,635 67,576
HMMR 884,601 550,768 2,384,202 22,464
HMCA 696,189 498,732 1,972,615 61,715
HMCIS 641,565 396,810 3,353,943 49,902
(*) Based on the subsidiary’s consolidated financial statements.
In millions of Korean Won
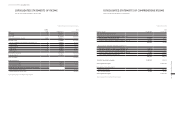
Name of subsidiaries Assets Liabilities Sales
Profit (loss)
for the year
Hyundai Capital Services, Inc. (*) ₩ 22,389,046 ₩ 19,136,092 ₩ 3,222,235 ₩ 391,427
Hyundai Card Co., Ltd. (*) 11,520,878 9,154,730 2,527,479 163,210
Hyundai Rotem Company (*) 4,274,897 2,485,374 3,299,370 126,076
Hyundai KEFICO Corporation (*) 894,606 481,021 1,666,971 98,432
HCA (*) 24,787,736 22,762,022 4,403,250 285,406
HMA 6,382,182 3,756,767 16,592,560 490,250
HMMA 3,031,145 1,294,805 7,385,302 479,606
HMMC 3,050,239 1,480,611 5,450,412 374,303
HMI (*) 1,904,660 968,802 4,736,902 220,593
HME (*) 1,130,991 1,084,122 5,531,337 4,164
HAC (*) 908,415 497,106 3,145,661 73,997
HMMR 1,285,326 606,948 2,750,925 209,710
HMCA 687,001 541,674 2,272,191 40,010
HMCIS 923,966 583,367 3,742,285 96,107
(*) Based on the subsidiary’s consolidated financial statements.
In millions of Korean Won
Condensed financial position and results of operations of the Company’s major consolidated subsidiaries as of and for the year
ended December 31, 2013, were as follows: