Hyundai 2014 Annual Report Download - page 63
Download and view the complete annual report
Please find page 63 of the 2014 Hyundai annual report below. You can navigate through the pages in the report by either clicking on the pages listed below, or by using the keyword search tool below to find specific information within the annual report.-
 1
1 -
2
-
3
-
4
-
5
-
6
-
7
-
8
-
9
-
10
-
11
-
12
-
13
-
14
-
15
-
16
-
17
-
18
-
19
-
20
-
21
-
22
-
23
-
24
-
25
-
26
-
27
-
28
-
29
-
30
-
31
-
32
-
33
-
34
-
35
-
36
-
37
-
38
-
39
-
40
-
41
-
42
-
43
-
44
-
45
-
46
-
47
-
48
-
49
-
50
-
51
-
52
-
 53
53 -
 54
54 -
 55
55 -
 56
56 -
 57
57 -
 58
58 -
 59
59 -
 60
60 -
 61
61 -
 62
62 -
 63
63 -
 64
64 -
 65
65 -
 66
66 -
 67
67 -
 68
68 -
 69
69 -
 70
70 -
 71
71 -
 72
72 -
 73
73 -
74
-
75
-
76
-
77
-
78
-
79
-
80
-
81
-
82
-
83
-
84
-
85
-
86
 |
 |
HYUNDAI MOTOR COMPANY Annual Report 2014
FINANCIAL STATEMENTS / 125124
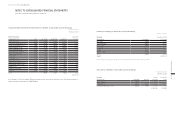
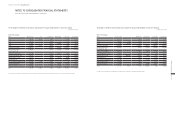
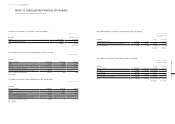
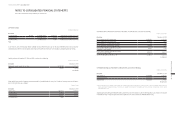
(4) Condensed additional financial information of the Group’s major joint ventures as of and for the year ended
December 31, 2014, is as follows:
In millions of Korean Won
Name of the
company
Cash and
cash
equivalents
Current
financial
liabilities
Non-current
financial
liabilities
Depreciation
and
amortization
Interest
income
Interest
expenses
Income tax
expense
BHMC ₩ 867,555 ₩ - ₩ 247,534 ₩ 290,920 ₩ 29,076 ₩ 54,141 ₩ 641,753
BHAF (*) 279,486 1,948,183 - 1,278 177,122 84,809 5,973
HMGC 44,836 49,153 127,834 4,369 1,146 6,912 16,832
CHMC 196,076 44,285 500,007 4,049 2,492 7,210 -
(*) Operating finance business of which total assets (liabilities) are included in current financial liabilities as BHAF does not distinguish current and non-current portion in
separate financial statements.
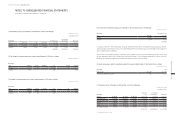
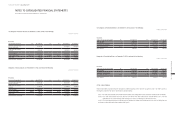
Condensed additional financial information of the Group’s major joint ventures as of and for the year ended December 31, 2013,
was as follows:
In millions of Korean Won
Name of the
company
Cash and
cash
equivalents
Current
financial
liabilities
Non-current
financial
liabilities
Depreciation
and
amortization
Interest
income
Interest
expenses
Income tax
expense
BHMC ₩ 573,257 ₩ - ₩ - ₩ 282,461 ₩ 15,426 ₩ 42,012 ₩ 645,700
HMGC 136,091 - - 5,191 4,069 4,276 19,167
CHMC 73,834 88,192 78,341 6,488 2,505 746 1,135
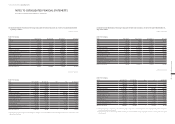
(5) The aggregate amounts of the Group’s share of the joint ventures’ and associates’, that are not individually material, profit
and comprehensive income for the years ended December 31, 2014 and 2013, are as follows:
In millions of Korean Won
Description December 31, 2014 December 31, 2013
Profit for the year ₩ 75,451 ₩ 73,320
Other comprehensive income 890 1,498
Total comprehensive income ₩ 76,341 ₩ 74,818
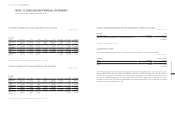
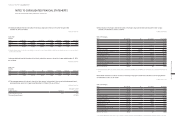
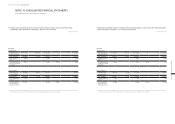
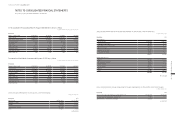
(6) Reconciliation of the Group’s share of net assets of the Group’s major joint ventures and associates to their carrying
amounts as of December 31, 2014, is as follows:
In millions of Korean Won
Name of the company
Group’s share of
net assets Goodwill
Unrealized loss
and others Carrying amounts
BHMC ₩ 2,202,923 ₩ - ₩ (23,287) ₩ 2,179,636
BHAF 193,624 - - 193,624
WAE 164,090 - - 164,090
HMGC 169,048 -(10,761) 158,287
CHMC 155,573 - - 155,573
Kia Motors Corporation 7,328,393 197,089 (42,510) 7,482,972
Hyundai Engineering & Construction Co., Ltd (*) 1,993,529 1,137,357 -3,130,886
Hyundai WIA Corporation 710,123 -(2,410) 707,713
Hyundai Powertech Co., Ltd. 386,574 -(5,759) 380,815
Hyundai HYSCO Co., Ltd. 275,529 27,172 (643) 302,058
Hyundai Dymos Inc. 290,812 -(1,443) 289,369
HMC Investment Securities Co., Ltd. 185,280 40,052 -225,332
Hyundai Commercial Inc. 196,471 - - 196,471
Eukor Car Carriers Inc. 169,870 -262 170,132
(*) The difference between the carrying amount and the fair value of the investee’s identifiable assets and liabilities as of the acquisition date, is included in the amount of net
assets.
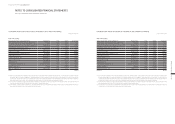
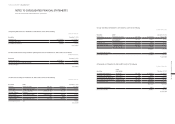
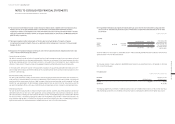
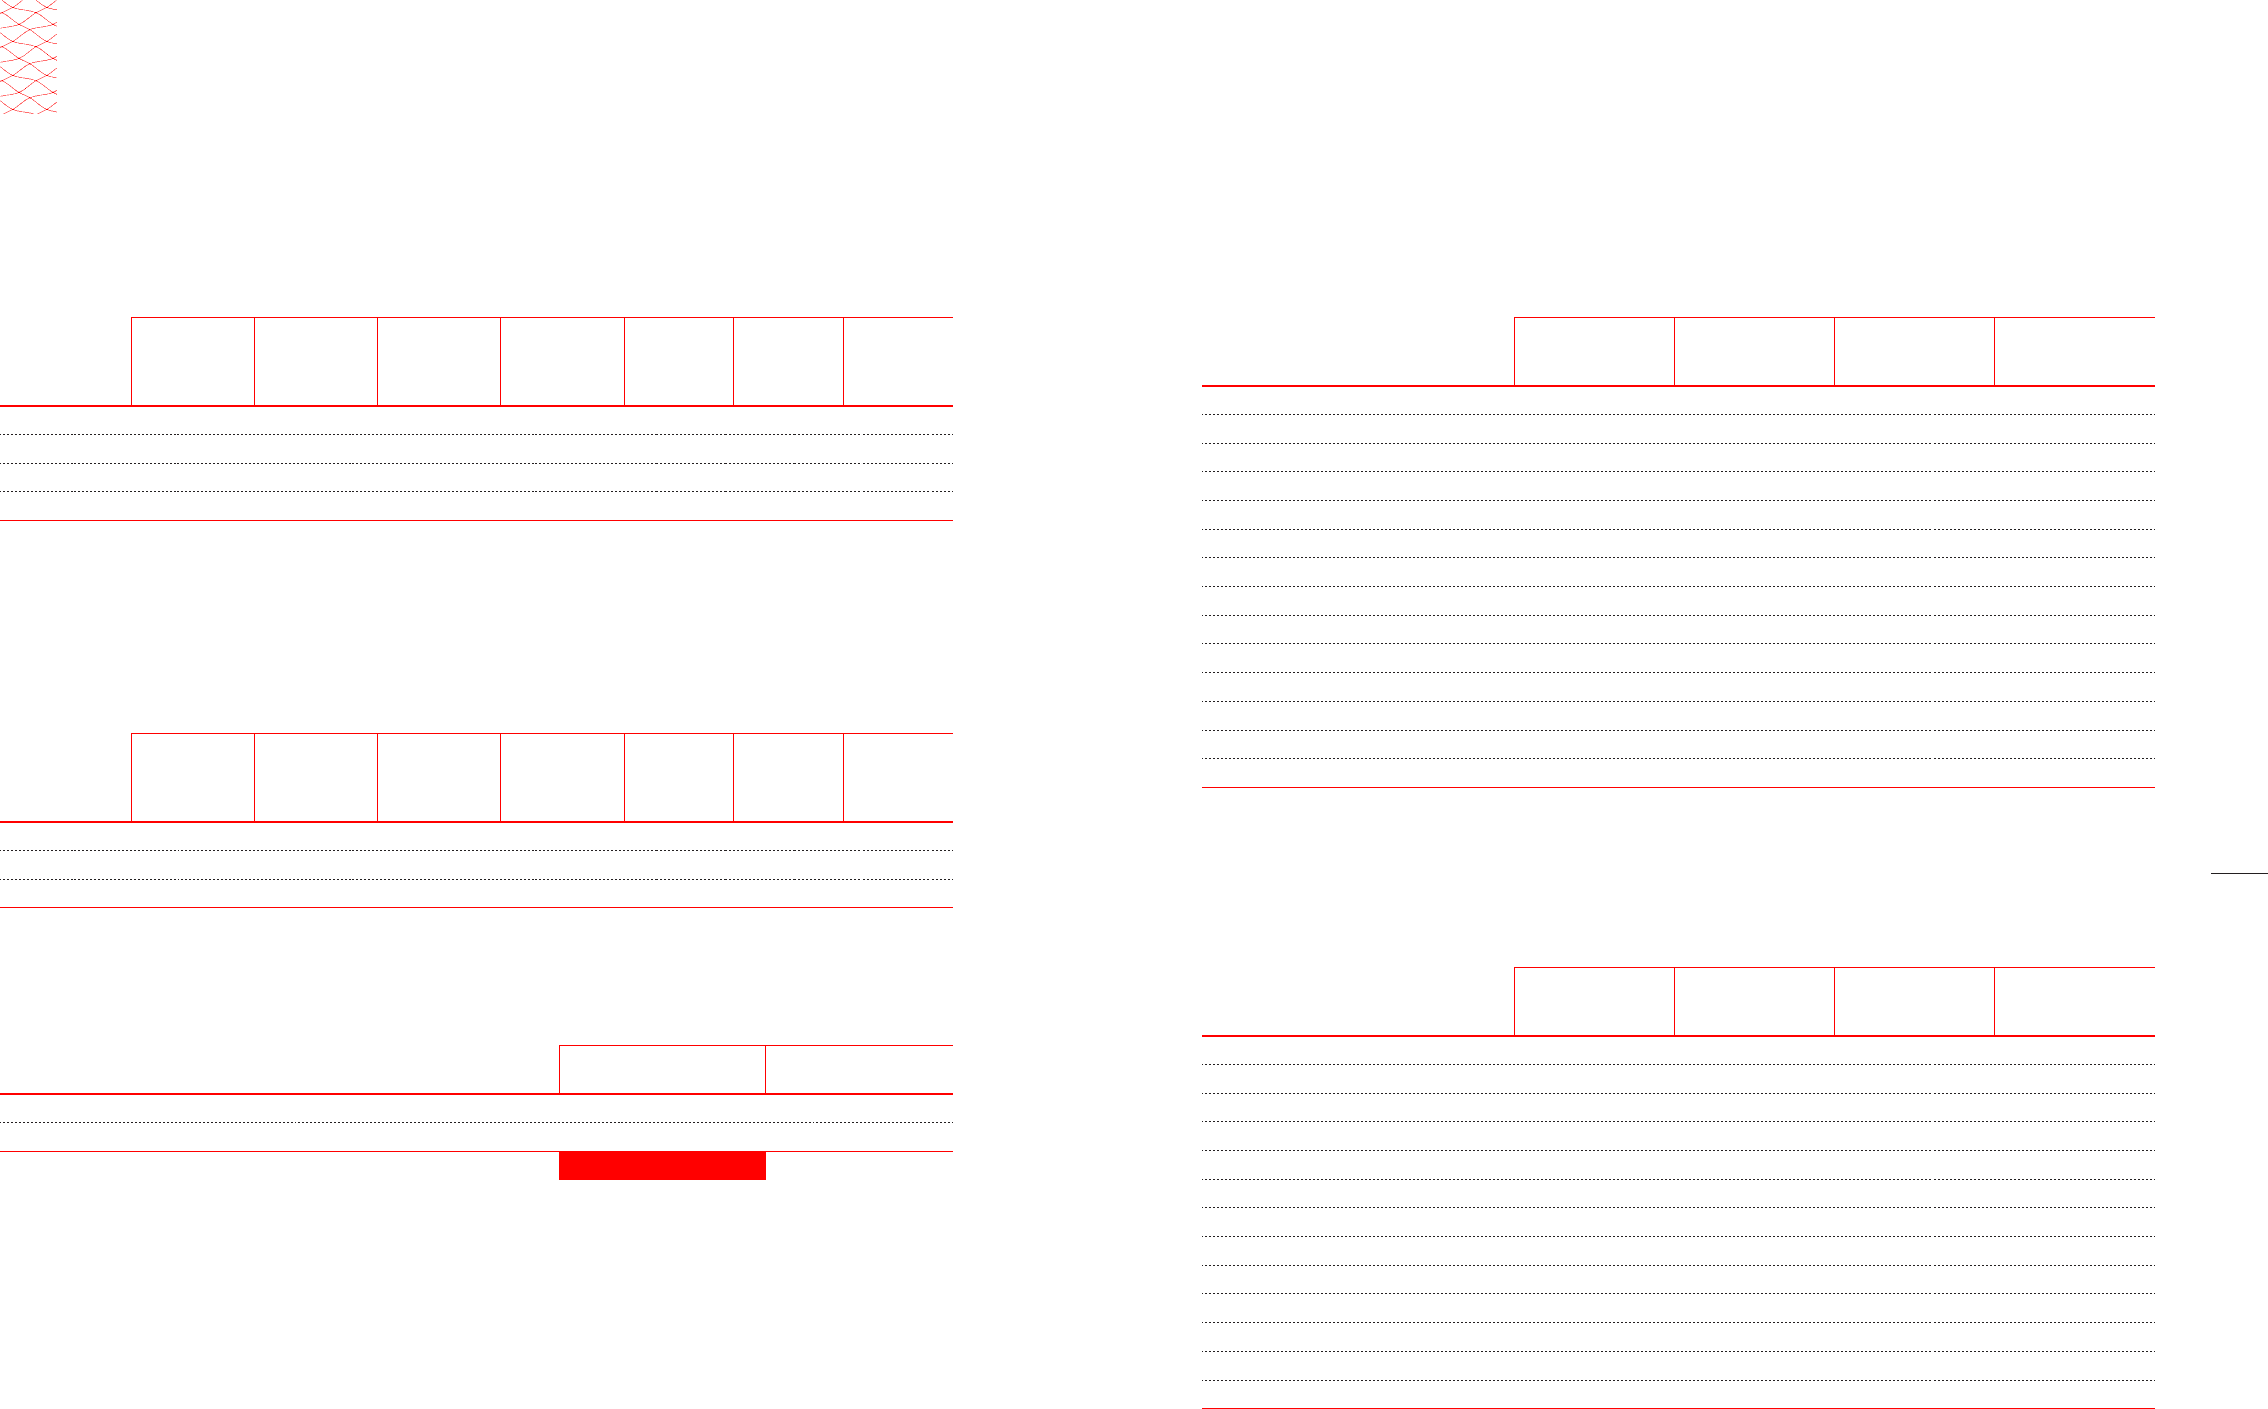
Reconciliation of the Group’s share of net assets of the Group’s major joint ventures and associates to their carrying amounts
as of December 31, 2013, was as follows:
In millions of Korean Won
Name of the company
Group’s share of
net assets Goodwill
Unrealized loss
and others Carrying amounts
BHMC ₩ 2,050,200 ₩ - ₩ (23,863) ₩ 2,026,337
WAE 129,783 - - 129,783
HMGC 163,074 - (9,251) 153,823
CHMC 132,014 - - 132,014
Kia Motors Corporation 6,605,359 197,089 (54,321) 6,748,127
Hyundai Engineering & Construction Co., Ltd (*) 1,913,447 1,137,357 - 3,050,804
Hyundai WIA Corporation 604,486 - (4,202) 600,284
Hyundai Powertech Co., Ltd. 345,223 - (9,996) 335,227
Hyundai HYSCO Co., Ltd. 210,104 27,172 (544) 236,732
Hyundai Dymos Inc. 272,312 - (1,777) 270,535
HMC Investment Securities Co., Ltd. 177,166 40,052 - 217,218
Hyundai Commercial Inc. 125,806 - - 125,806
Eukor Car Carriers Inc. 148,604 - 262 148,866
(*) The difference between the carrying amount and the fair value of the investee’s identifiable assets and liabilities as of the acquisition date, is included in the amount of net assets.
NOTES TO CONSOLIDATED FINANCIAL STATEMENTS
AS OF AND FOR THE YEARS ENDED DECEMBER 31, 2014 AND 2013