Hyundai 2014 Annual Report Download - page 5
Download and view the complete annual report
Please find page 5 of the 2014 Hyundai annual report below. You can navigate through the pages in the report by either clicking on the pages listed below, or by using the keyword search tool below to find specific information within the annual report.-
 1
1 -
 2
2 -
 3
3 -
 4
4 -
 5
5 -
 6
6 -
 7
7 -
 8
8 -
 9
9 -
 10
10 -
 11
11 -
 12
12 -
 13
13 -
 14
14 -
 15
15 -
 16
16 -
17
-
18
-
19
-
20
-
21
-
22
-
23
-
24
-
25
-
26
-
27
-
28
-
29
-
30
-
31
-
32
-
33
-
34
-
35
-
36
-
37
-
38
-
39
-
40
-
41
-
42
-
43
-
44
-
45
-
46
-
47
-
48
-
49
-
50
-
51
-
52
-
53
-
54
-
55
-
56
-
57
-
58
-
59
-
60
-
61
-
62
-
63
-
64
-
65
-
66
-
67
-
68
-
69
-
70
-
71
-
72
-
73
-
74
-
75
-
76
-
77
-
78
-
79
-
80
-
81
-
82
-
83
-
84
-
85
-
86
 |
 |
HYUNDAI MOTOR COMPANY Annual Report 2014
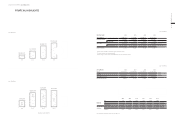
BUSINESS HIGHLIGHTS
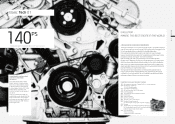
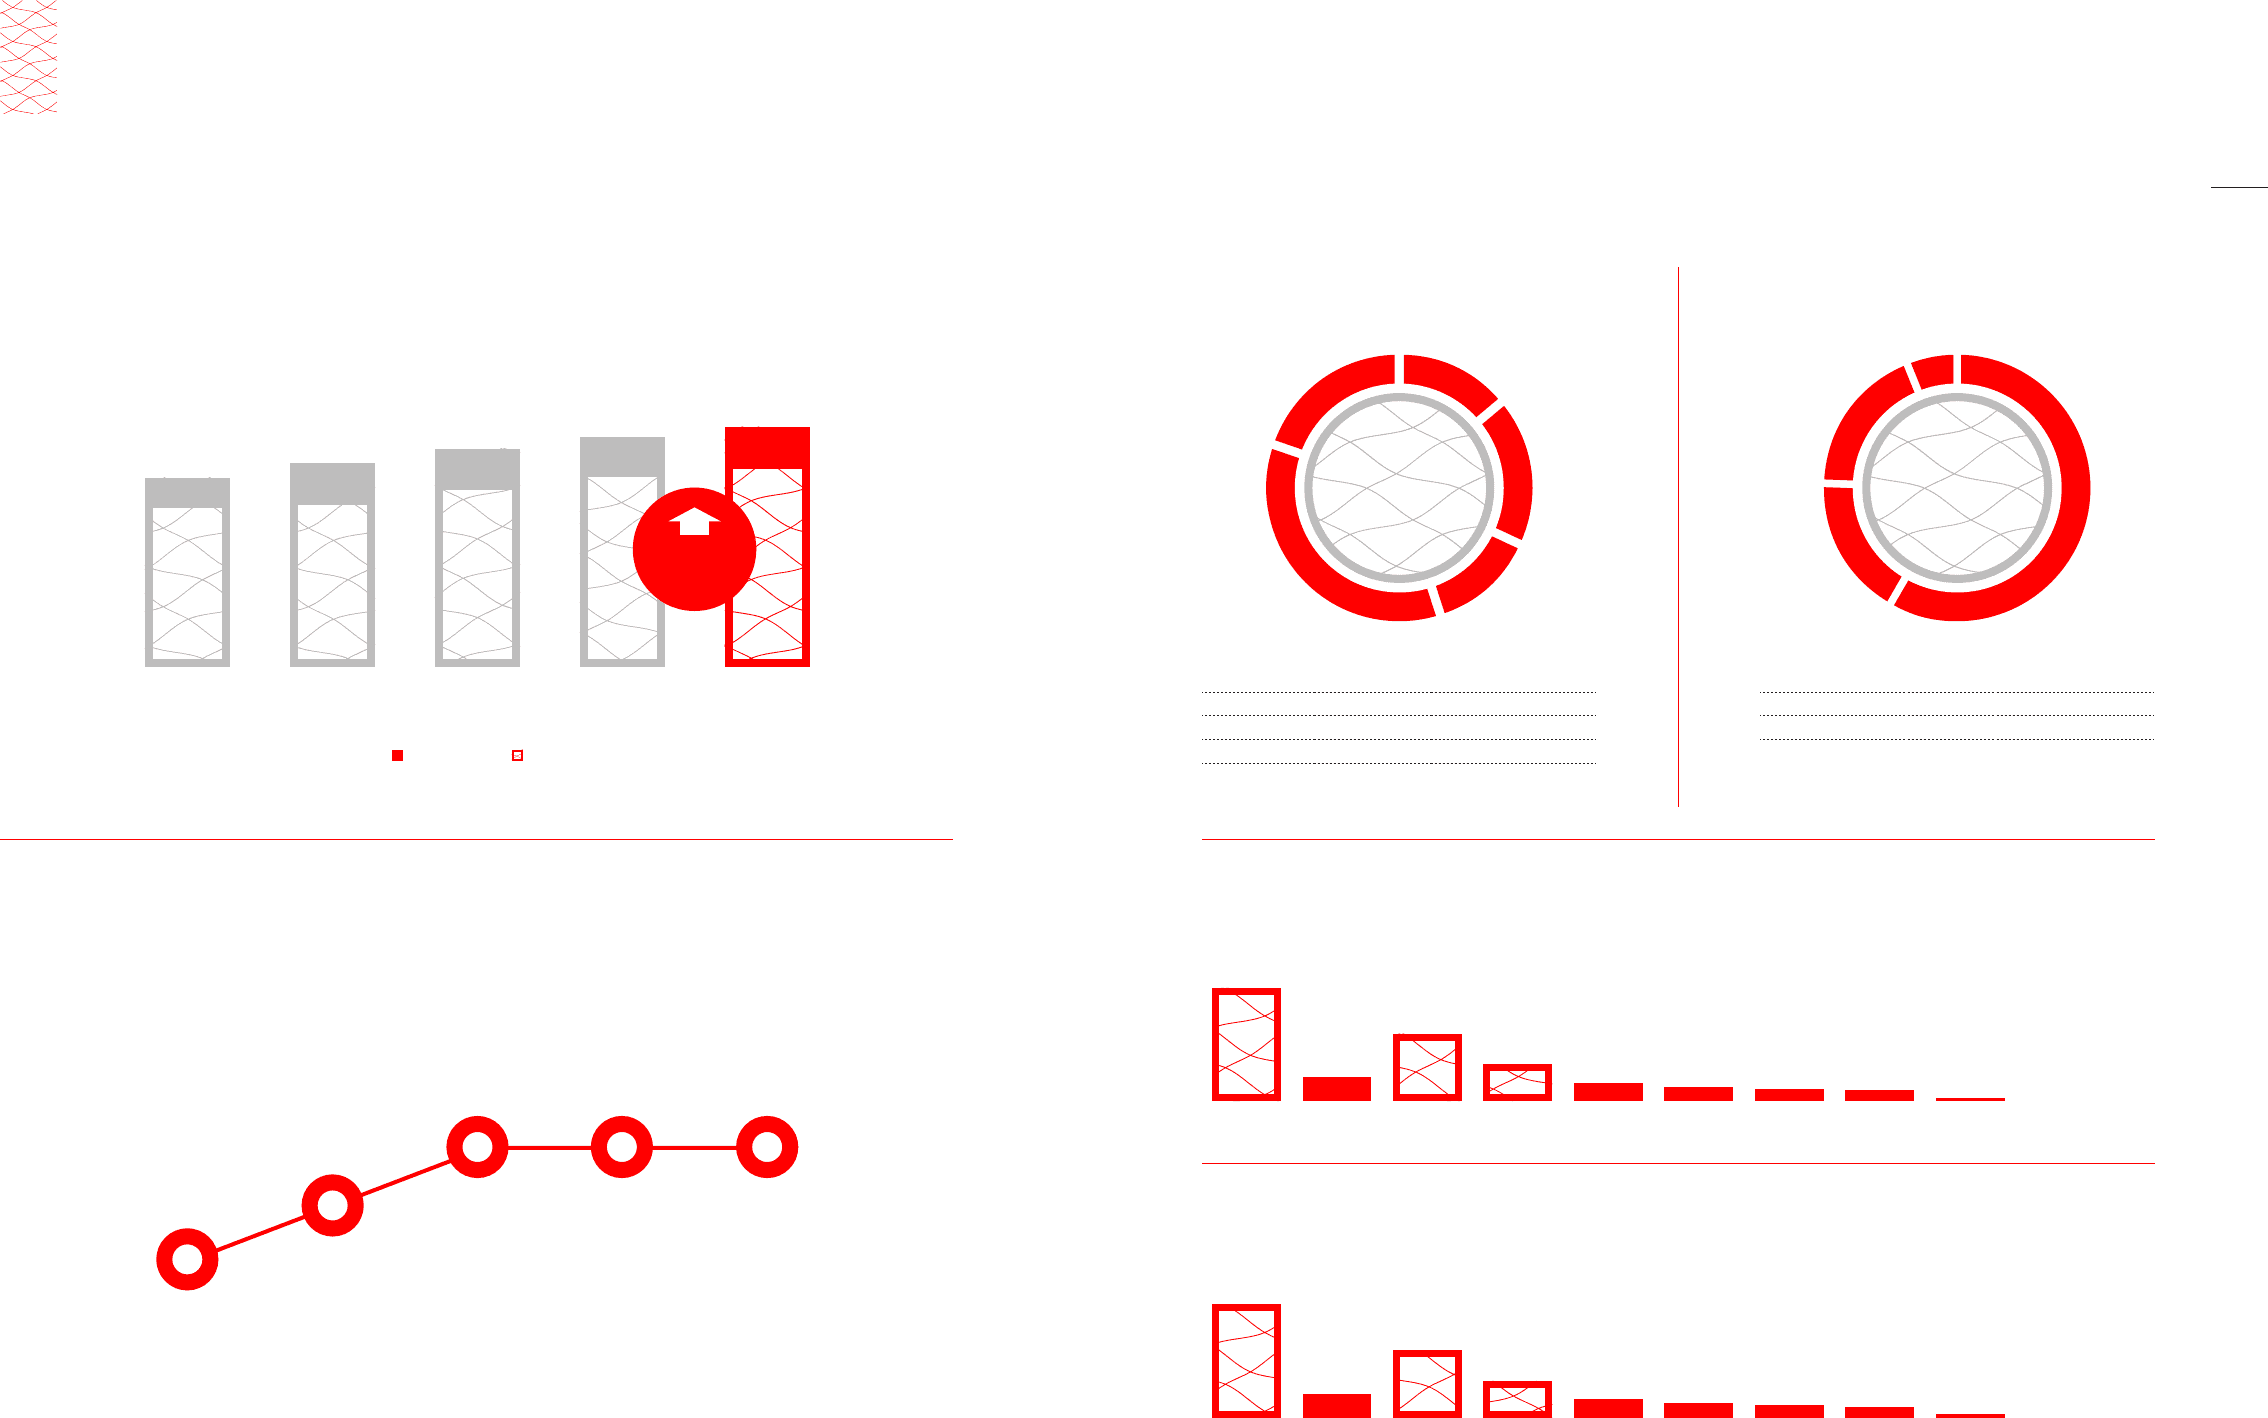
GLOBAL RETAIL SALES SALES BY REGION SALES BY SEGMENT
Unit : Thousand Unit : Thousand Unit : Thousand
4,621
2013
3,980
641
4,392
2012
3,724
667
4,099
2011
3,417
682
3,701
2010
3,043
658
4,835
2014
4,151
684
OverseasKorea
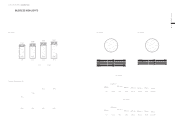
GLOBAL MARKET SHARE
*Source : IHS Global Demand Jan. 2015
2011
5.4%
2010
5.1%
2012
5.7%
2013
5.7%
2014
5.7%
1. Korea 684 14.1%
2. N. America 864 17.9%
3. Europe 642 13.3%
4. Asia 1,700 35.2%
5. Others 946 19.6%
1. Small PC 2,909 58.6%
2. Mid-Large PC 853 17.2%
3. RV 908 18.3%
4. CV 292 5.9%
SALES BY PLANT Unit : Thousand
1,879(37.9%)
1,120(22.6%)
613(12.4%)
308(6.2%)237(4.8%)203(4.1%)179(3.6%)27(0.6%)
396(8.0%)
Korea CzechChina TurkeyUS RussiaIndia Brazil China(CV)
PRODUCTION BY PLANT Unit : Thousand
1,876(37.9%)
1,120(22.6%)
611(12.3%)
307(6.2%)237(4.8%)203(4.1%)179(3.6%)23(0.5%)
399(8.0%)
Korea CzechChina TurkeyUS RussiaIndia Brazil China(CV)
Total
4,962 1
2
3
4
Total
4,835
1
2
3
4
5
4.6%
Business Highlights 08 / 09
Total
4,962
Total
4,956