Hyundai 2014 Annual Report Download - page 41
Download and view the complete annual report
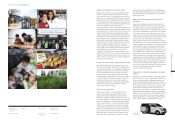
Please find page 41 of the 2014 Hyundai annual report below. You can navigate through the pages in the report by either clicking on the pages listed below, or by using the keyword search tool below to find specific information within the annual report.-
 1
1 -
2
-
3
-
4
-
5
-
6
-
7
-
8
-
9
-
10
-
11
-
12
-
13
-
14
-
15
-
16
-
17
-
18
-
19
-
20
-
21
-
22
-
23
-
24
-
25
-
26
-
27
-
28
-
29
-
30
-
 31
31 -
 32
32 -
 33
33 -
 34
34 -
 35
35 -
 36
36 -
 37
37 -
 38
38 -
 39
39 -
 40
40 -
 41
41 -
 42
42 -
 43
43 -
 44
44 -
 45
45 -
 46
46 -
 47
47 -
 48
48 -
 49
49 -
 50
50 -
 51
51 -
52
-
53
-
54
-
55
-
56
-
57
-
58
-
59
-
60
-
61
-
62
-
63
-
64
-
65
-
66
-
67
-
68
-
69
-
70
-
71
-
72
-
73
-
74
-
75
-
76
-
77
-
78
-
79
-
80
-
81
-
82
-
83
-
84
-
85
-
86
 |
 |

HYUNDAI MOTOR COMPANY Annual Report 2014
FINANCIAL STATEMENTS / 8180
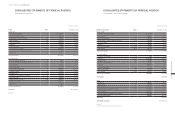
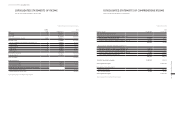
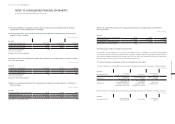
CONSOLIDATED STATEMENTS OF INCOME
FOR THE YEARS ENDED DECEMBER 31, 2014 AND 2013
CONSOLIDATED STATEMENTS OF COMPREHENSIVE INCOME
FOR THE YEARS ENDED DECEMBER 31, 2014 AND 2013
NOTES 2014 2013
Sales 25,38 ₩ 89,256,319 ₩ 87,307,636
Cost of sales 30 70,126,276 67,859,491
Gross profit 19,130,043 19,448,145
Selling and administrative expenses 26,30 11,580,057 11,132,648
Operating income 7,549,986 8,315,497
Gain on investments in joint ventures and associates, net 27 2,388,658 3,057,109
Finance income 28 881,883 805,261
Finance expenses 28 601,019 552,709
Other income 29 1,039,865 1,138,001
Other expenses 29,30 1,308,099 1,066,453
Income before income tax 9,951,274 11,696,706
Income tax expense 32 2,301,806 2,703,209
Profit for the year 7,649,468 8,993,497
Profit attributable to:
Owners of the Company 7,346,807 8,541,834
Non-controlling interests 302,661 451,663
Earnings per share attributable to the owners of the Company: 31
Basic earnings per common share ₩ 27,037 ₩ 31,441
Diluted earnings per common share ₩ 27,037 ₩ 31,441
See accompanying notes to consolidated financial statements.
2014 2013
Profit for the year ₩ 7,649,468 ₩ 8,993,497
Other comprehensive income (expenses):
Items that will not be reclassified subsequently to profit or loss:
Remeasurements of defined benefit plans (379,062) 249,790
Changes in retained earnings of equity-accounted investees, net (82,187) 13,206
(461,249) 262,996
Items that may be reclassified subsequently to profit or loss:
Gain (loss) on available-for-sale (“AFS”) financial assets, net (225,611) 59,155
Gain (loss) on valuation of cash flow hedge derivatives, net (62,752) 6,263
Changes in share of earnings of equity-accounted investees, net 80,382 (60,746)
Loss on foreign operations translation, net (379,757) (383,309)
(587,738) (378,637)
Total other comprehensive expenses (1,048,987) (115,641)
Total comprehensive income ₩ 6,600,481 ₩ 8,877,856
Comprehensive income attributable to:
Owners of the Company 6,405,423 8,441,925
Non-controlling interests 195,058 435,931
Total comprehensive income ₩ 6,600,481 ₩ 8,877,856
See accompanying notes to consolidated financial statements.
In millions of Korean Won, except per share amounts In millions of Korean Won