Hyundai 2014 Annual Report Download - page 43
Download and view the complete annual report
Please find page 43 of the 2014 Hyundai annual report below. You can navigate through the pages in the report by either clicking on the pages listed below, or by using the keyword search tool below to find specific information within the annual report.
HYUNDAI MOTOR COMPANY Annual Report 2014
FINANCIAL STATEMENTS / 8584
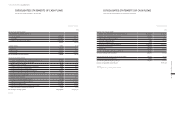
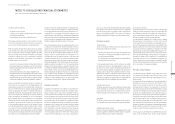
CONSOLIDATED STATEMENTS OF CASH FLOWS
FOR THE YEARS ENDED DECEMBER 31, 2014 AND 2013
2014 2013
Cash flows from operating activities:
Cash generated from operations: (NOTES : 34)
Profit for the year ₩ 7,649,468 ₩ 8,993,497
Adjustments 8,369,656 7,332,779
Changes in operating assets and liabilities (12,421,149) (13,217,233)
3,597,975 3,109,043
Interest received 704,872 703,243
Interest paid (1,393,607) (1,444,092)
Dividend received 1,030,074 787,804
Income tax paid (1,818,469) (1,947,532)
Net cash provided by operating activities 2,120,845 1,208,466
Cash flows from investing activities:
Proceeds from withdrawal of short-term financial instruments, net 10,877,563 224,284
Proceeds from disposals of other financial assets 200,167 71,693
Receipts from other receivables 48,493 76,395
Proceeds from disposals of property, plant and equipment 47,045 306,471
Proceeds from disposals of intangible assets 8,130 26,673
Proceeds from disposals of investments in subsidiaries 453,215 -
Proceeds from disposals of investments in joint ventures and associates 23,811 1,504
Acquisitions of other financial assets (12,990,529) (107,515)
Increases in other receivables (50,971) (96,776)
Purchases of long-term financial instruments (32,143) (2,854,853)
Acquisitions of property, plant and equipment (3,353,809) (3,171,093)
Acquisitions of intangible assets (1,372,086) (991,064)
Acquisitions of investments in joint ventures and associates (130,417) (131,088)
Other cash receipts from investing activities, net 76,521 24,637
Net cash used in investing activities ₩ (6,195,010) ₩ (6,620,732)
(Continued)
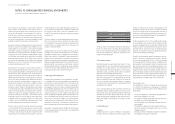
2014 2013
Cash flows from financing activities:
Proceeds from (repayment of) short-term borrowings, net ₩ 1,412,120 ₩ (864,251)
Proceeds from long-term debt and debentures 19,001,138 23,632,277
Paid-in capital increase of subsidiaries 147,707 476,493
Purchases of subsidiaries’ stock 5,649 (175,275)
Disposals of subsidiaries’ stock 23,678 -
Repayment of long-term debt and debentures (15,120,767) (16,669,654)
Purchases of treasury stock (144,973) -
Dividends paid (586,928) (632,529)
Other cash payments from financing activities, net (30,647) (51,611)
Net cash provided by financing activities 4,706,977 5,715,450
Effect of exchange rate changes on cash and cash equivalents (408,729) (190,092)
Net increase in cash and cash equivalents 224,083 113,092
Cash and cash equivalents, beginning of the year 6,872,430 6,759,338
Cash and cash equivalents, end of the year ₩ 7,096,513 ₩ 6,872,430
(Concluded)
See accompanying notes to consolidated financial statements.
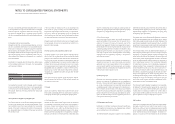
CONSOLIDATED STATEMENTS OF CASH FLOWS
FOR THE YEARS ENDED DECEMBER 31, 2014 AND 2013 (CONTINUED)
In millions of Korean Won In millions of Korean Won


