Hyundai 2014 Annual Report Download - page 62
Download and view the complete annual report
Please find page 62 of the 2014 Hyundai annual report below. You can navigate through the pages in the report by either clicking on the pages listed below, or by using the keyword search tool below to find specific information within the annual report.-
 1
1 -
2
-
3
-
4
-
5
-
6
-
7
-
8
-
9
-
10
-
11
-
12
-
13
-
14
-
15
-
16
-
17
-
18
-
19
-
20
-
21
-
22
-
23
-
24
-
25
-
26
-
27
-
28
-
29
-
30
-
31
-
32
-
33
-
34
-
35
-
36
-
37
-
38
-
39
-
40
-
41
-
42
-
43
-
44
-
45
-
46
-
47
-
48
-
49
-
50
-
51
-
 52
52 -
 53
53 -
 54
54 -
 55
55 -
 56
56 -
 57
57 -
 58
58 -
 59
59 -
 60
60 -
 61
61 -
 62
62 -
 63
63 -
 64
64 -
 65
65 -
 66
66 -
 67
67 -
 68
68 -
 69
69 -
 70
70 -
 71
71 -
 72
72 -
73
-
74
-
75
-
76
-
77
-
78
-
79
-
80
-
81
-
82
-
83
-
84
-
85
-
86
 |
 |
HYUNDAI MOTOR COMPANY Annual Report 2014
FINANCIAL STATEMENTS / 123122
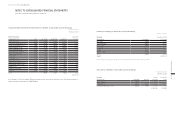
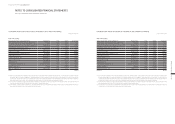
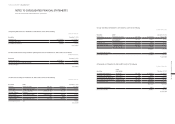
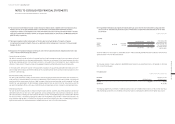
(3) Condensed financial information of the Group’s major joint ventures and associates as of and for the year ended December
31, 2014, is as follows:
In millions of Korean Won
Name of the company
Current
assets
Non-current
assets
Current
liabilities
Non-current
liabilities
BHMC ₩ 8,017,912 ₩ 2,822,478 ₩ 6,104,511 ₩ 330,032
BHAF (*) 2,313,511 - 1,948,183 -
WAE 810,860 882,572 396,641 554,056
HMGC 408,159 302,466 244,695 127,834
CHMC 474,710 575,607 239,165 500,007
Kia Motors Corporation 16,655,401 24,388,801 11,974,338 6,585,999
Hyundai Engineering & Construction Co., Ltd. 13,642,088 4,797,605 8,256,605 3,216,775
Hyundai WIA Corporation 3,452,727 2,484,590 1,830,980 1,257,464
Hyundai Powertech Co., Ltd. 815,573 1,305,272 752,801 340,814
Hyundai HYSCO Co., Ltd. 1,736,275 805,183 1,032,851 576,592
Hyundai Dymos Inc. 1,078,838 780,341 662,110 589,631
HMC Investment Securities Co., Ltd. (*) 5,592,617 - 4,918,694 -
Hyundai Commercial Inc. (*) 4,778,907 - 4,284,158 -
Eukor Car Carriers Inc. 503,455 2,541,803 316,999 1,312,677
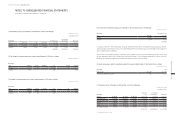
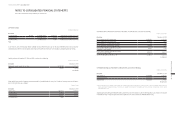
In millions of Korean Won
Name of the company Sales
Profit for the
year from
continuing
operations
Profit for the
year from
discontinued
operations
Other
comprehensive
Income
(expense)
Total
comprehensive
income
BHMC ₩ 19,755,886 ₩ 1,925,153 ₩ - ₩ - ₩ 1,925,153
BHAF (*) 181,756 17,817 - - 17,817
WAE 1,778,572 138,819 - - 138,819
HMGC 1,543,128 59,947 - - 59,947
CHMC 362,750 (9,716) - - (9,716)
Kia Motors Corporation 47,097,049 2,993,593 -(416,539) 2,577,054
Hyundai Engineering & Construction Co., Ltd. 17,386,959 586,697 -(23,108) 563,589
Hyundai WIA Corporation 7,595,606 439,189 -6,214 445,403
Hyundai Powertech Co., Ltd. 3,253,110 103,744 -104 103,848
Hyundai HYSCO Co., Ltd. 4,214,317 164,826 -(47,635) 117,191
Hyundai Dymos Inc. 2,550,730 31,068 -(6,687) 24,381
HMC Investment Securities Co., Ltd. (*) 515,456 6,610 -317 6,927
Hyundai Commercial Inc. (*) 350,831 24,711 -19,521 44,232
Eukor Car Carriers Inc 2,487,114 196,984 -60,726 257,710
(*) Operating finance business of which total assets (liabilities) are included in current assets (liabilities) as they do not distinguish current and non-current portion in their
separate financial statements.
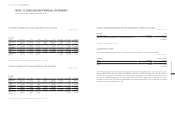
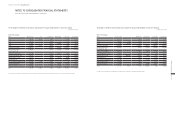
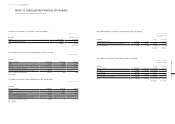
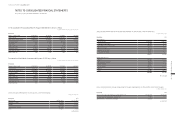
Condensed financial information of the Group’s major joint ventures and associates as of and for the year ended December 31,
2013, was as follows:
In millions of Korean Won
Name of the company
Current
assets
Non-current
assets
Current
liabilities
Non-current
liabilities
BHMC ₩ 6,724,971 ₩ 2,579,744 ₩ 5,109,071 ₩ 95,244
WAE 663,359 774,846 303,861 544,423
HMGC 386,643 90,778 151,274 -
CHMC 285,878 408,432 351,942 78,341
Kia Motors Corporation 13,472,386 22,709,654 10,806,238 5,121,007
Hyundai Engineering & Construction Co., Ltd. 11,108,964 3,624,248 6,905,974 2,624,163
Hyundai WIA Corporation 2,769,033 2,091,422 1,535,457 1,013,737
Hyundai Powertech Co., Ltd. 841,587 1,240,856 785,041 374,060
Hyundai HYSCO Co., Ltd. 1,470,314 787,872 1,111,124 444,852
Hyundai Dymos Inc. 867,798 775,516 578,069 482,460
HMC Investment Securities Co., Ltd (*1,2) 4,552,120 - 3,885,124 -
Hyundai Commercial Inc. (*2) 4,154,667 - 3,800,298 -
Eukor Car Carriers Inc. 563,589 1,984,373 341,512 1,194,435
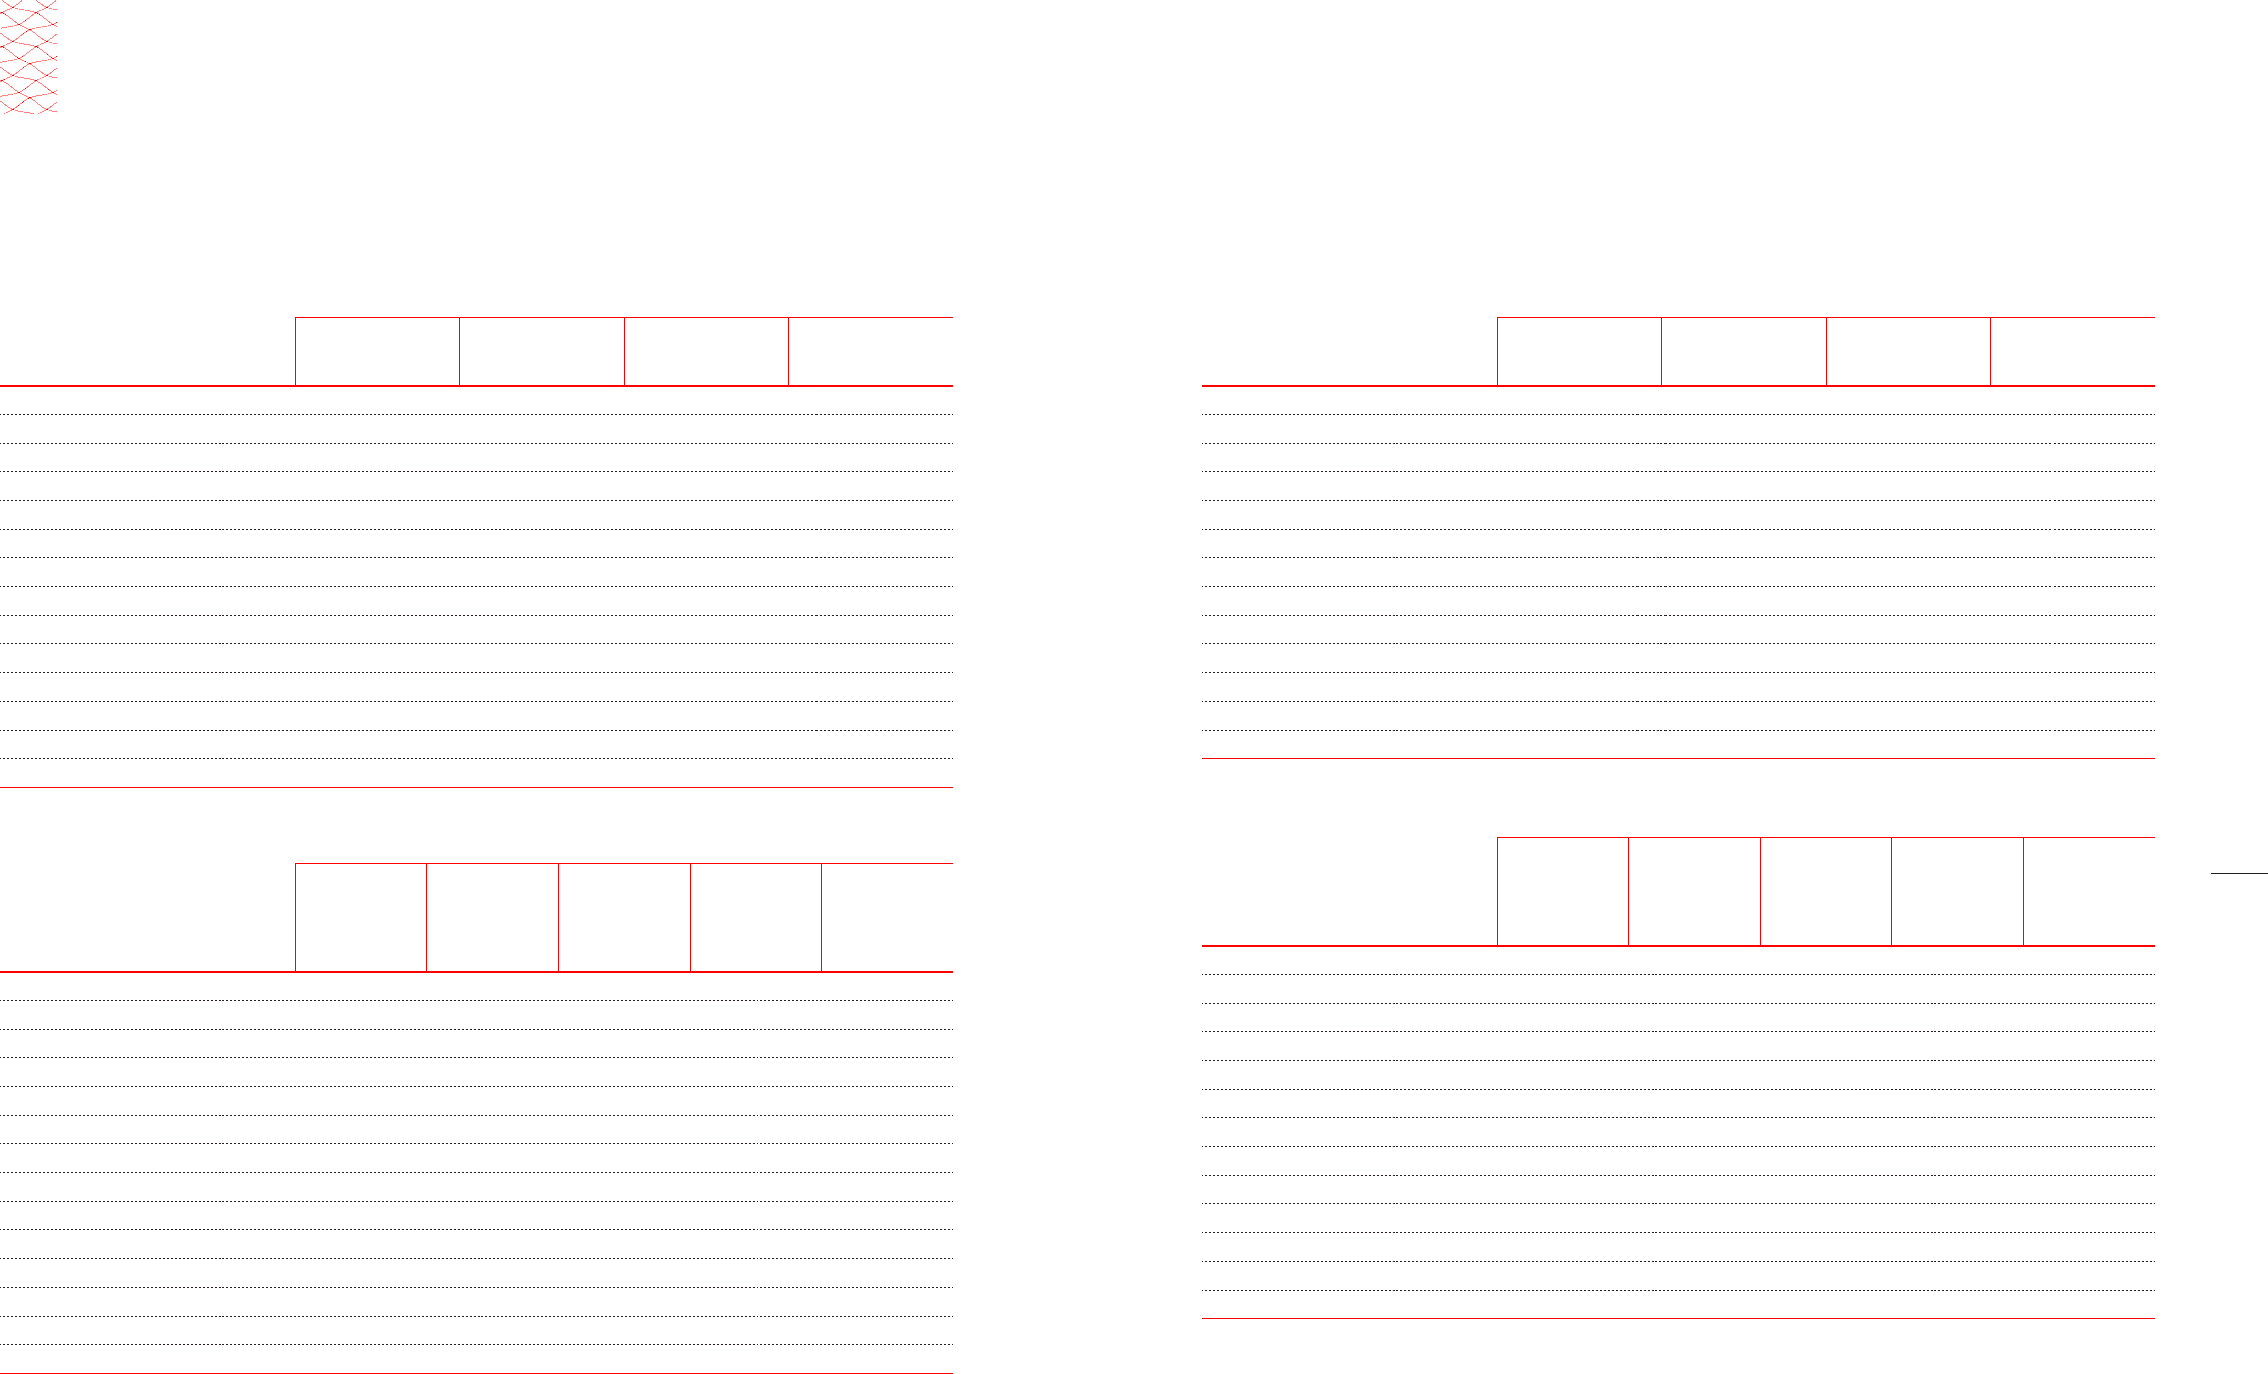
In millions of Korean Won
Name of the company Sales
Profit for the
year from
continuing
operations
Profit for the
year from
discontinued
operations
Other
comprehensive
Income
(expense)
Total
comprehensive
income
BHMC ₩ 19,432,536 ₩ 1,937,099 ₩ - ₩ - ₩ 1,937,099
WAE 1,599,574 125,285 - - 125,285
HMGC 1,830,188 66,577 - - 66,577
CHMC 435,110 1,273 - - 1,273
Kia Motors Corporation 47,597,897 3,817,059 - (147,086) 3,669,973
Hyundai Engineering & Construction Co., Ltd. 13,938,287 569,644 - (102,351) 467,293
Hyundai WIA Corporation 7,091,994 425,007 - 17,000 442,007
Hyundai Powertech Co., Ltd. 3,273,053 97,851 - 4,318 102,169
Hyundai HYSCO Co., Ltd. 4,046,137 53,597 1,555,167 (2,849) 1,605,915
Hyundai Dymos Inc. 2,185,540 84,835 - 3,036 87,871
HMC Investment Securities Co., Ltd (*1,2) 750,633 2,096 - (5,062) (2,966)
Hyundai Commercial Inc. (*2) 346,231 36,617 - (15,387) 21,230
Eukor Car Carriers Inc. 2,598,281 255,829 - (14,770) 241,059
(*1) Although the closing date of the fiscal year of HMC Investment Securities Co., Ltd. is March, 31, the financial statements, used for applying the equity method, are prepared for
the same reporting periods as the Company’s.
(*2) Operating finance business of which total assets (liabilities) are included in current assets (liabilities) as they do not distinguish current and non-current portion in their separate
financial statements.
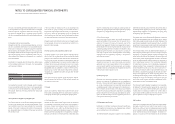
NOTES TO CONSOLIDATED FINANCIAL STATEMENTS
AS OF AND FOR THE YEARS ENDED DECEMBER 31, 2014 AND 2013