Hyundai 2014 Annual Report Download - page 70
Download and view the complete annual report
Please find page 70 of the 2014 Hyundai annual report below. You can navigate through the pages in the report by either clicking on the pages listed below, or by using the keyword search tool below to find specific information within the annual report.-
 1
1 -
2
-
3
-
4
-
5
-
6
-
7
-
8
-
9
-
10
-
11
-
12
-
13
-
14
-
15
-
16
-
17
-
18
-
19
-
20
-
21
-
22
-
23
-
24
-
25
-
26
-
27
-
28
-
29
-
30
-
31
-
32
-
33
-
34
-
35
-
36
-
37
-
38
-
39
-
40
-
41
-
42
-
43
-
44
-
45
-
46
-
47
-
48
-
49
-
50
-
51
-
52
-
53
-
54
-
55
-
56
-
57
-
58
-
59
-
 60
60 -
 61
61 -
 62
62 -
 63
63 -
 64
64 -
 65
65 -
 66
66 -
 67
67 -
 68
68 -
 69
69 -
 70
70 -
 71
71 -
 72
72 -
 73
73 -
 74
74 -
 75
75 -
 76
76 -
 77
77 -
 78
78 -
 79
79 -
 80
80 -
81
-
82
-
83
-
84
-
85
-
86
 |
 |

HYUNDAI MOTOR COMPANY Annual Report 2014
FINANCIAL STATEMENTS / 139138
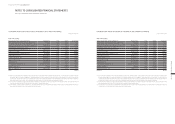
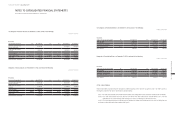
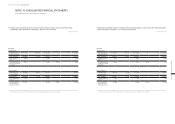
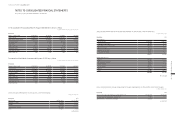
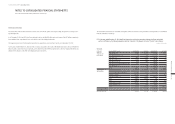
(9) The quantitative information about significant unobservable inputs used in the fair value measurements categorized within
Level 3 of the fair-value hierarchy and the description of relationships of significant unobservable inputs to the fair value
are as follows:
In millions of Korean Won
Description
Fair value at
December 31, 2014
Valuation
Techniques Unobservable inputs Range
Description of
relationship
Unlisted
equity
securities
₩ 247,483 Discounted
cash flow
Sales growth rate 0.5% ~ 8.2% If the sales growth
rate and the pre-tax
operating income ratio
rise or the discount
rate declines, the fair
value increases.
Pre-tax operating income ratio 2.1% ~ 21.8%
Discount rate 7.9% ~ 14.0%
The Group believes that the changes of unobservable inputs to reflect reasonably possible alternative assumptions would not have
significant effects on the fair value measurements.
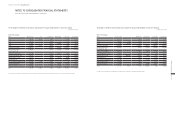
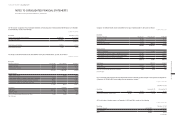
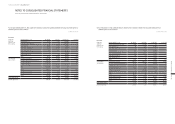
20. CAPITAL STOCK:
The Company’s number of shares authorized is 600,000,000 shares. Common stock and preferred stock as of December 31, 2014 and
2013, consist of the following:
(1) Common stock
In millions of Korean Won, except par value
Description December 31, 2014 December 31, 2013
Issued 220,276,479 shares 220,276,479 shares
Par value ₩ 5,000 ₩ 5,000
Capital stock ₩ 1,157,982 ₩ 1,157,982
The Company completed stock retirement of 10,000,000 common shares and 1,320,000 common shares as of March 5, 2001 and May 4,
2004, respectively. Due to these stock retirements, the total face value of outstanding stock differs from the capital stock amount.
NOTES TO CONSOLIDATED FINANCIAL STATEMENTS
AS OF AND FOR THE YEARS ENDED DECEMBER 31, 2014 AND 2013
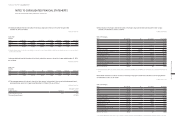
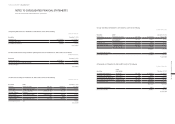
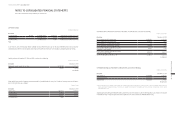
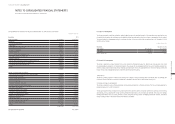
(6) The commission income (financial services revenue) arising from financial assets or liabilities other than financial assets or
liabilities at FVTPL for the years ended December 31, 2014 and 2013, are ₩1,646,656 million and ₩1,646,100 million,
respectively. In addition, the fee expenses (cost of sales from financial services) occurring from financial assets or liabilities
other than financial assets or liabilities at FVTPL for the years ended December 31, 2014 and 2013, are ₩787,994 million and
₩897,756 million, respectively.
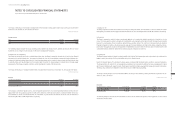
(7) The Group recognizes transfers between levels of the fair-value hierarchy at the date of the event or change in
circumstances that caused the transfer. There are no significant transfers between Level 1 and Level 2 for the year ended
December 31, 2014.
(8) Descriptions of the valuation techniques and the inputs used in the fair value measurements categorized within Level 2 and
Level 3 of the fair-value hierarchy are as follows:
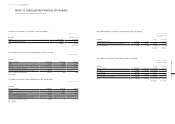
- Currency forwards and options
Fair value of currency forwards and options is measured based on forward exchange rate quoted in the current market at the end
of the reporting period, which has the same remaining period of derivatives to be measured. If the forward exchange rate, which
has the same remaining period of currency forward and option, is not quoted in the current market, fair value is measured using
estimates of similar period of forward exchange rate by applying interpolation method with quoted forward exchange rates.
As the inputs used to measure fair value of currency forwards and options are supported by observable market data, such as for-
ward exchange rates, the Group classified the estimates of fair value measurements of the currency forwards and options as Level
2 of the fair-value hierarchy.
- Debt instruments including corporate bonds
Fair value of debt instruments including corporate bonds is measured applying discounted cash flow method. The rate used to dis-
count cash flows is determined based on swap rate and credit spreads of debt instruments, which have the similar credit rating and
period quoted in the current market with those of debt instruments including corporate bonds that should be measured. The Group
classifies fair value measurements of debt instruments including corporate bonds as Level 2 of the fair-value hierarchy since the
rate, which has significant effects on fair value of debt instruments including corporate bonds, is based on observable market data.
- Unlisted equity securities
Fair value of unlisted equity securities is measured using discounted cash flow projection, and certain assumptions not based on
observable market prices or rate, such as sales growth rate, pre-tax operating income ratio and discount rate based on business
plan and circumstance of industry are used to estimate the future cash flow. The weighted-average cost of capital used to discount
the future cash flows, is calculated by applying the Capital Asset Pricing Model, using the data of similar listed companies. The
Group determines that the effect of estimation and assumptions referred above affecting fair value of unlisted equity securities is
significant and classifies fair value measurements of unlisted securities as Level 3 of the fair-value hierarchy.