Hyundai 2014 Annual Report Download - page 56
Download and view the complete annual report
Please find page 56 of the 2014 Hyundai annual report below. You can navigate through the pages in the report by either clicking on the pages listed below, or by using the keyword search tool below to find specific information within the annual report.-
 1
1 -
2
-
3
-
4
-
5
-
6
-
7
-
8
-
9
-
10
-
11
-
12
-
13
-
14
-
15
-
16
-
17
-
18
-
19
-
20
-
21
-
22
-
23
-
24
-
25
-
26
-
27
-
28
-
29
-
30
-
31
-
32
-
33
-
34
-
35
-
36
-
37
-
38
-
39
-
40
-
41
-
42
-
43
-
44
-
45
-
 46
46 -
 47
47 -
 48
48 -
 49
49 -
 50
50 -
 51
51 -
 52
52 -
 53
53 -
 54
54 -
 55
55 -
 56
56 -
 57
57 -
 58
58 -
 59
59 -
 60
60 -
 61
61 -
 62
62 -
 63
63 -
 64
64 -
 65
65 -
 66
66 -
67
-
68
-
69
-
70
-
71
-
72
-
73
-
74
-
75
-
76
-
77
-
78
-
79
-
80
-
81
-
82
-
83
-
84
-
85
-
86
 |
 |
HYUNDAI MOTOR COMPANY Annual Report 2014
FINANCIAL STATEMENTS / 111110
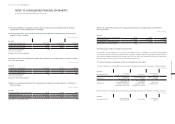
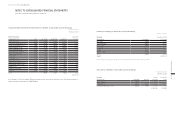
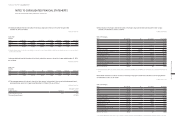
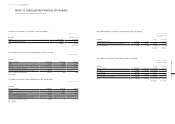
(3) Equity instruments classified into AFS financial assets as of December 31, 2014 and 2013, consist of the following:
In millions of Korean Won
December 31, 2014 December 31, 2013
Name of the company
Ownership
percentage
Acquisition
cost
Valuation
difference Book value Book value
Hyundai Steel Co., Ltd. 7.87% ₩ 791,681 ₩ (209,158) ₩ 582,523 ₩ 791,681
Hyundai Glovis Co., Ltd. 4.88% 210,688 323,031 533,719 422,947
Korea Aerospace Industries, Co., Ltd. 10.00% 151,086 236,865 387,951 282,678
Hyundai Heavy Industries Co., Ltd. 2.88% 56,924 194,926 251,850 562,830
Hyundai Oil Refinery Co., Ltd. 4.35% 53,734 84,555 138,289 145,523
Hyundai Green Food Co., Ltd. 2.36% 15,005 28,726 43,731 38,769
Hyundai Development Company 0.60% 9,025 8,390 17,415 10,440
Hyundai Finance Corporation 9.29% 9,888 477 10,365 10,666
KT Corporation 0.09% 8,655 (1,152) 7,503 7,575
NICE Holdings Co., Ltd. 1.30% 3,491 4,006 7,497 5,801
Doosan Capital Co., Ltd. 7.14% 10,000 (2,744) 7,256 10,348
Hyundai Merchant Marine Co., Ltd. 0.38% 9,161 (2,231) 6,930 7,900
NICE Information Service Co., Ltd. 2.25% 3,312 3,149 6,461 4,180
Ubivelox Co., Ltd. 5.15% 1,710 2,360 4,070 4,585
Hyundai Asan Corporation 1.88% 22,500 (20,383) 2,117 2,117
Nesscap, Inc. 4.47% 1,997 (798) 1,199 1,104
Others 101,878 (4,035) 97,843 82,012
₩ 1,460,735 ₩ 645,984 ₩ 2,106,719 ₩ 2,391,156
As of December 31, 2014, the valuation difference between the book value and the acquisition cost of AFS equity instruments in-
cludes the cumulative impairment loss of ₩24,968 million.
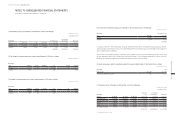
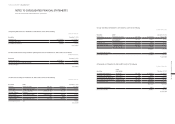
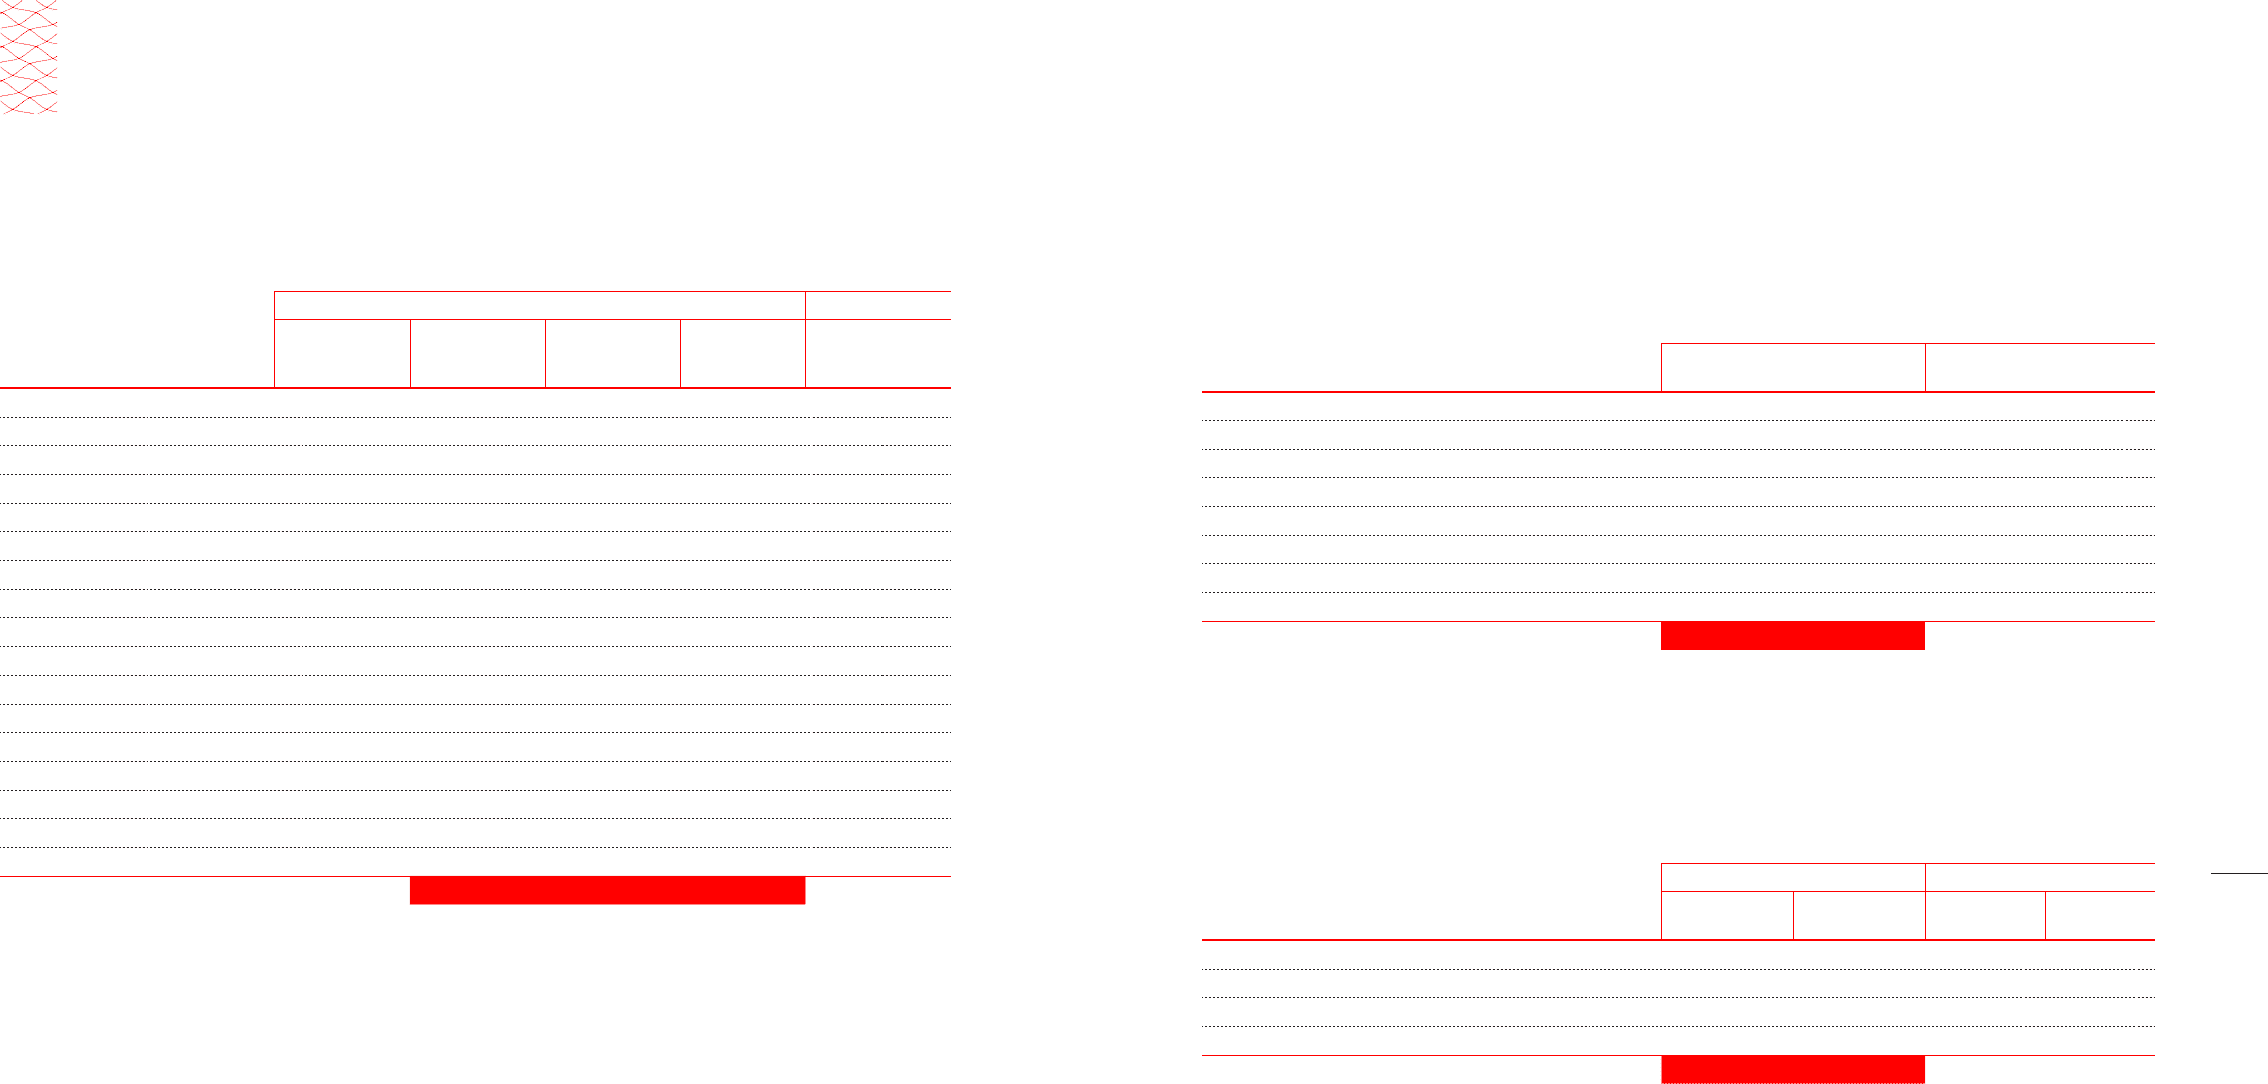
6. INVENTORIES:
Inventories as of December 31, 2014 and 2013, consist of the following:
In millions of Korean Won
Description December 31, 2014 December 31, 2013
Finished goods ₩ 4,178,587 ₩ 3,771,488
Merchandise 108,428 105,385
Semi-finished goods 428,282 434,834
Work in progress 360,888 410,024
Raw materials 1,232,731 1,138,616
Supplies 236,715 204,657
Materials in transit 437,564 540,666
Others 434,044 467,446
Total (*) ₩ 7,417,239 ₩ 7,073,116
(*) As of December 31, 2014 and 2013, valuation allowance in amount of ₩69,434 million and ₩81,145 million, respectively, is included.
7. OTHER ASSETS:
Other assets as of December 31, 2014 and 2013, consist of the following:
In millions of Korean Won
December 31, 2014 December 31, 2013
Description Current Non-current Current Non-current
Accrued income ₩ 424,478 ₩ 10,003 ₩ 362,854 ₩ 498
Advanced payments 568,905 -700,542 -
Prepaid expenses 295,665 201,836 291,282 90,589
Prepaid value added tax and others 284,647 22,814 313,258 63,813
₩ 1,573,695 ₩ 234,653 ₩ 1,667,936 ₩ 154,900
NOTES TO CONSOLIDATED FINANCIAL STATEMENTS
AS OF AND FOR THE YEARS ENDED DECEMBER 31, 2014 AND 2013