Hyundai 2014 Annual Report Download - page 4
Download and view the complete annual report
Please find page 4 of the 2014 Hyundai annual report below. You can navigate through the pages in the report by either clicking on the pages listed below, or by using the keyword search tool below to find specific information within the annual report.-
 1
1 -
 2
2 -
 3
3 -
 4
4 -
 5
5 -
 6
6 -
 7
7 -
 8
8 -
 9
9 -
 10
10 -
 11
11 -
 12
12 -
 13
13 -
 14
14 -
 15
15 -
16
-
17
-
18
-
19
-
20
-
21
-
22
-
23
-
24
-
25
-
26
-
27
-
28
-
29
-
30
-
31
-
32
-
33
-
34
-
35
-
36
-
37
-
38
-
39
-
40
-
41
-
42
-
43
-
44
-
45
-
46
-
47
-
48
-
49
-
50
-
51
-
52
-
53
-
54
-
55
-
56
-
57
-
58
-
59
-
60
-
61
-
62
-
63
-
64
-
65
-
66
-
67
-
68
-
69
-
70
-
71
-
72
-
73
-
74
-
75
-
76
-
77
-
78
-
79
-
80
-
81
-
82
-
83
-
84
-
85
-
86
 |
 |
HYUNDAI MOTOR COMPANY Annual Report 2014
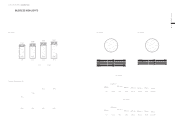
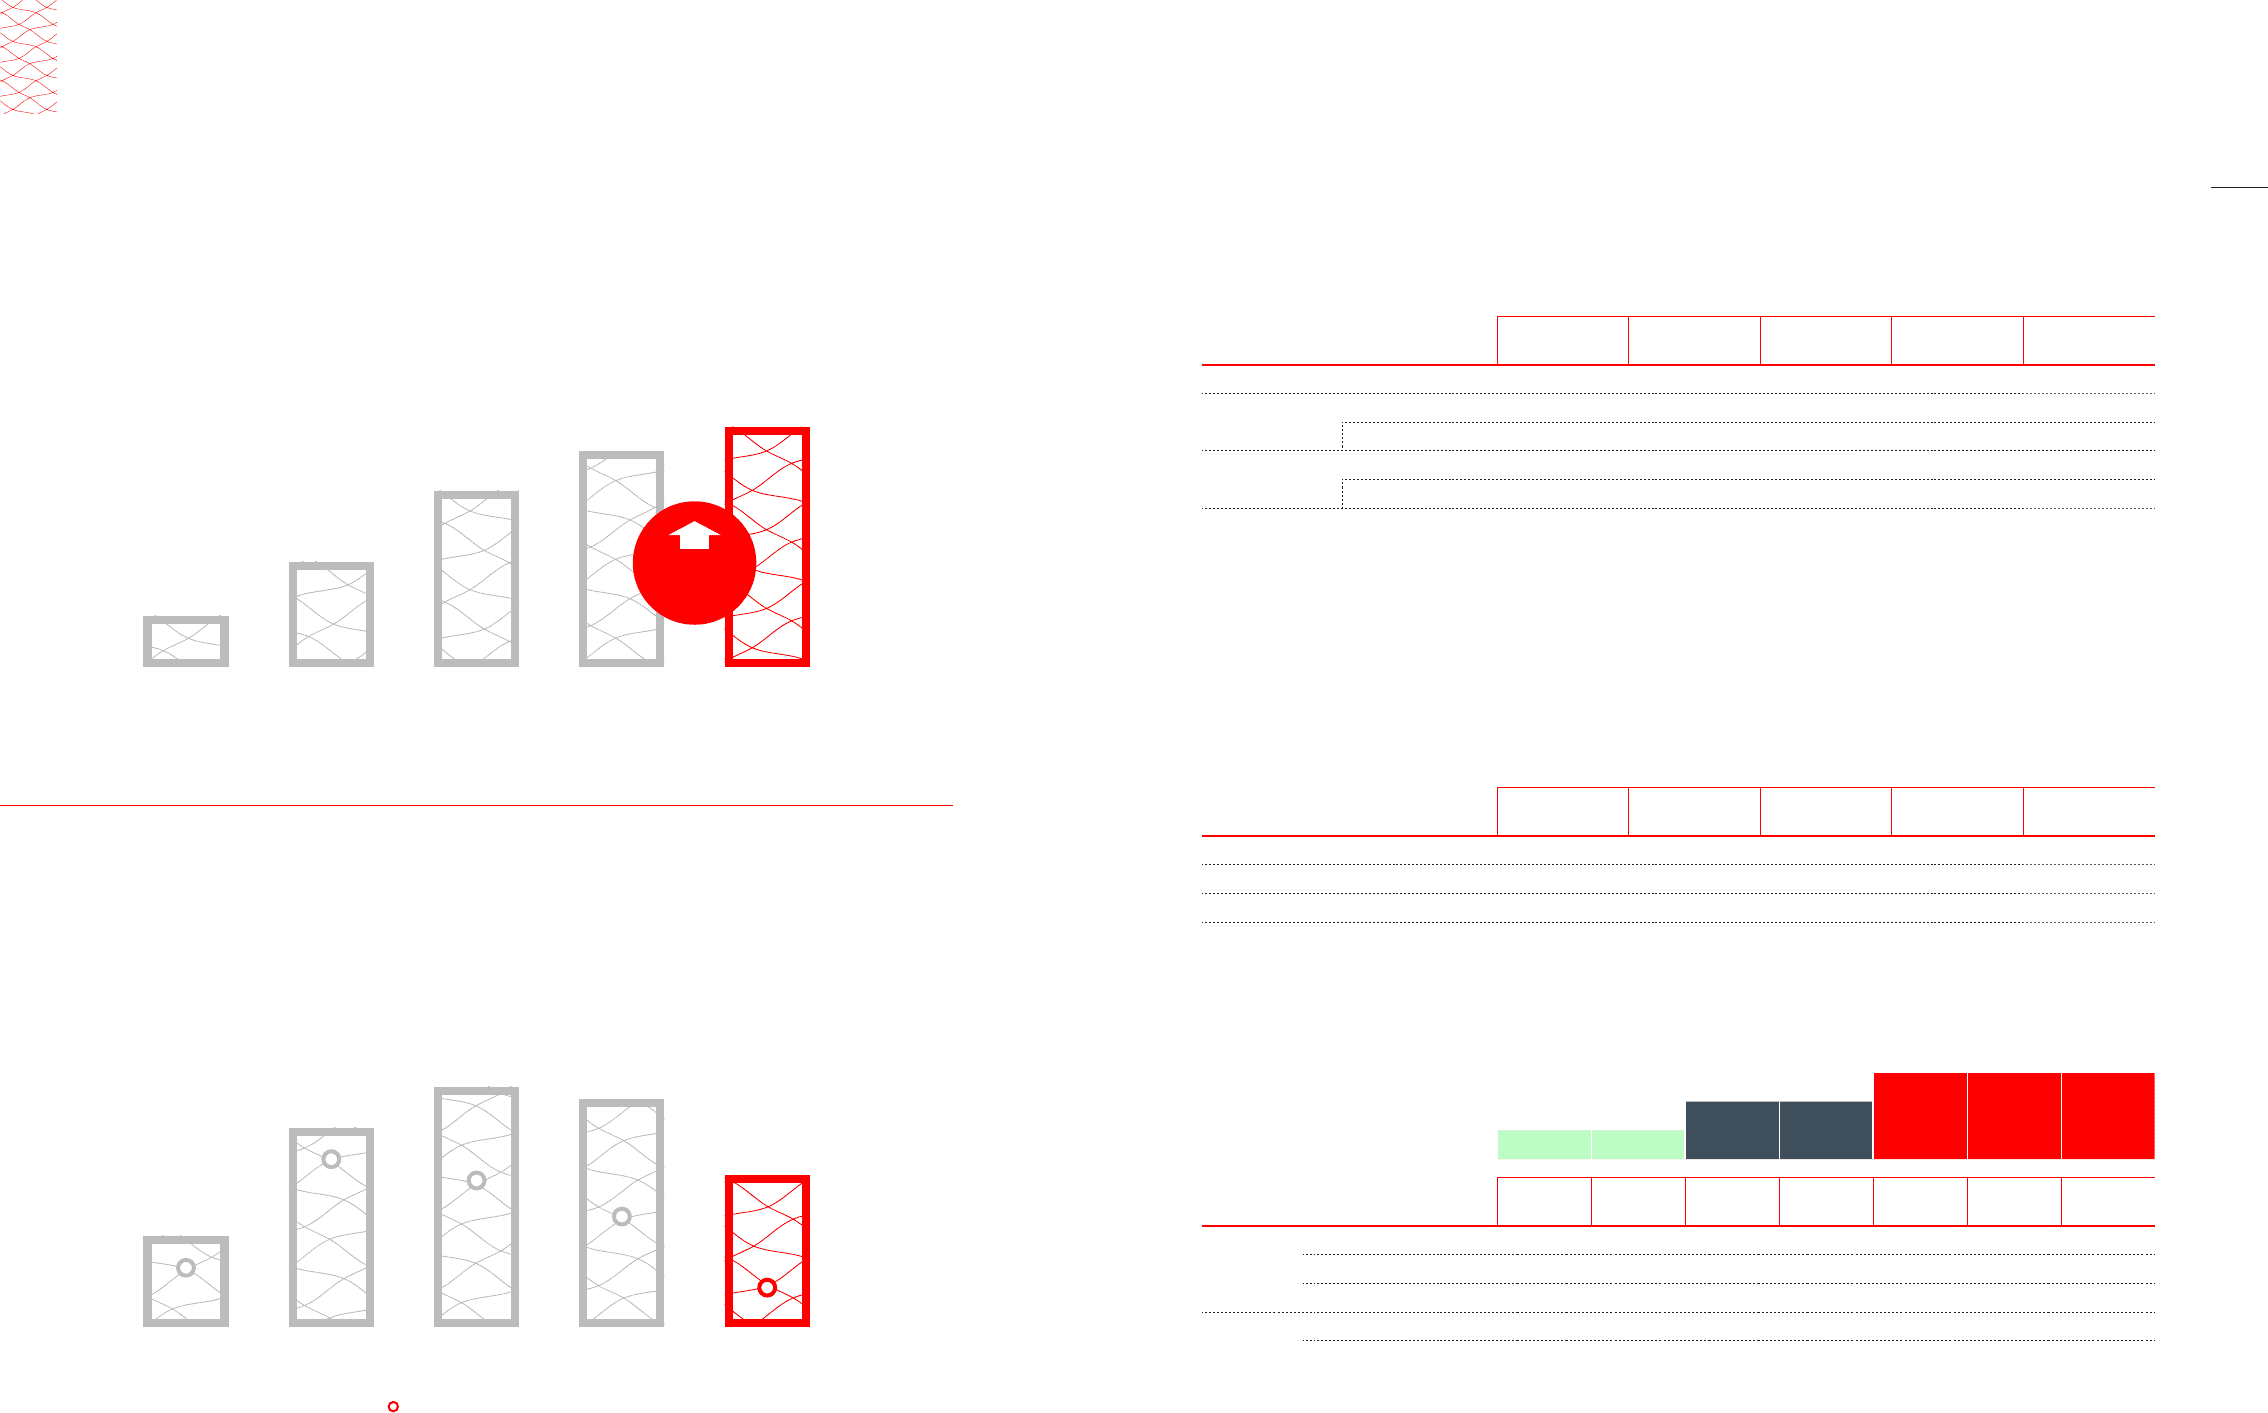
CREDIT RATING
CONSOLIDATED STATEMENTS OF INCOME
FOR THE YEAR 2010 2011 2012 2013 2014
Sales Revenue166,985,271 77,797,895 84,469,721 87,307,636 89,256,319
Operating Income 5,918,492 8,028,829 8,440,601 8,315,497 7,549,986
Margin(%) 8.8% 10.3% 10.0% 9.5% 8.5%
Net Income26,001,182 8,104,863 9,061,132 8,993,497 7,649,468
Margin(%) 9.0% 10.4% 10.7% 10.3% 8.6%
Basic EPS(KRW)320,516 28,200 31,532 31,441 27,037
1 Business results of BHMC is accounted in equity income accounting
2 Net income includes non-controlling interest
3 Basic earnings per common share attributable to the owners of the Parent Company
2008 2009 2010 2011 2012 2013 2014
Domestic
KIS AA AA AA+ AA+ AAA AAA AAA
NICE AA AA AA+ AA+ AAA AAA AAA
Korea Rating AA AA AA+ AA+ AAA AAA AAA
Overseas S&P BBB- BBB- BBB BBB BBB+ BBB+ BBB+
Moody’s Baa3 Baa3 Baa2 Baa2 Baa1 Baa1 Baa1
*Jan. 2015, S&P upgraded the credit rating for HMC to A-
BBB/Baa2
BBB-/Baa3
2008 2009 2010 2011 2012 2013 2014
BBB+/Baa1
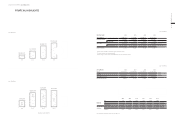
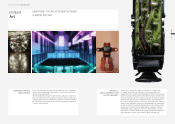
SALES REVENUE
CONSOLIDATED STATEMENTS OF FINANCIAL POSITION
Unit : KRW Million
AT YEAR END 2010 2011 2012 2013 2014
Assets 94,714,131 109,479,975 121,537,814 133,421,479 147,225,117
Liabilities 61,826,158 69,152,273 73,620,239 76,838,690 84,604,552
Shareholder’s Equity 32,887,973 40,327,702 47,917,575 56,582,789 62,620,565
Liab. to Eqt. Ratio(%) 188.0% 171.5% 153.6% 135.8% 135.1%
Unit : KRW Million
Unit : KRW Million
FINANCIAL HIGHLIGHTS
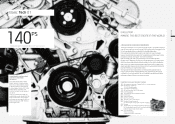
OPERATING INCOME
Unit : KRW Million
77,797,895
2011
66,985,271
2010
5,918,492
2010
84,469,721
2012
87,307,636
2013
89,256,319
2014
2.2%
8,028,829
2011
10.3
8.8
8,440,601
2012
10.0
8,315,497
2013
9.5
7,549,986
2014
8.5
Operating Income Margin(%)
Financial Highlights 06 / 07