Honeywell 2010 Annual Report Download - page 99
Download and view the complete annual report
Please find page 99 of the 2010 Honeywell annual report below. You can navigate through the pages in the report by either clicking on the pages listed below, or by using the keyword search tool below to find specific information within the annual report.-
 1
1 -
2
-
3
-
4
-
5
-
6
-
7
-
8
-
9
-
10
-
11
-
12
-
13
-
14
-
15
-
16
-
17
-
18
-
19
-
20
-
21
-
22
-
23
-
24
-
25
-
26
-
27
-
28
-
29
-
30
-
31
-
32
-
33
-
34
-
35
-
36
-
37
-
38
-
39
-
40
-
41
-
42
-
43
-
44
-
45
-
46
-
47
-
48
-
49
-
50
-
51
-
52
-
53
-
54
-
55
-
56
-
57
-
58
-
59
-
60
-
61
-
62
-
63
-
64
-
65
-
66
-
67
-
68
-
69
-
70
-
71
-
72
-
73
-
74
-
75
-
76
-
77
-
78
-
79
-
80
-
81
-
82
-
83
-
84
-
85
-
86
-
87
-
88
-
 89
89 -
 90
90 -
 91
91 -
 92
92 -
 93
93 -
 94
94 -
 95
95 -
 96
96 -
 97
97 -
 98
98 -
 99
99 -
 100
100 -
 101
101 -
 102
102 -
 103
103 -
 104
104 -
 105
105 -
 106
106 -
 107
107 -
 108
108 -
 109
109 -
110
-
111
-
112
-
113
-
114
-
115
-
116
-
117
-
118
-
119
-
120
-
121
-
122
-
123
-
124
-
125
-
126
-
127
-
128
-
129
-
130
-
131
-
132
-
133
-
134
-
135
-
136
-
137
-
138
-
139
-
140
-
141
-
142
-
143
-
144
-
145
-
146
-
147
-
148
-
149
-
150
-
151
-
152
-
153
-
154
-
155
-
156
-
157
-
158
-
159
-
160
-
161
-
162
-
163
-
164
-
165
-
166
-
167
-
168
-
169
-
170
-
171
-
172
-
173
-
174
-
175
-
176
-
177
-
178
-
179
-
180
-
181
-
182
-
183
 |
 |

HONEYWELL INTERNATIONAL INC.
NOTES TO FINANCIAL STATEMENTS—(Continued)
(Dollars in millions, except per share amounts)
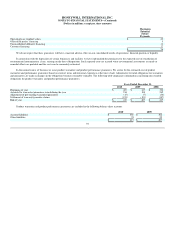
The following tables summarize the balance sheet impact, including the benefit obligations, assets and funded status associated with our significant
pension and other postretirement benefit plans at December 31, 2010 and 2009.
Pension Benefits
U.S. Plans Non-U.S. Plans
2010 2009 2010 2009
Change in benefit obligation:
Benefit obligation at beginning of year $ 13,620 $ 11,678 $ 4,266 $ 3,368
Service cost 221 183 51 41
Interest cost 768 785 228 208
Plan amendments 117 — — 2
Actuarial (gains) losses 1,211 1,879 150 616
Benefits paid (947) (931) (181) (180)
Settlements and curtailments — — — (5)
Other — 26 (141) 216
Benefit obligation at end of year 14,990 13,620 4,373 4,266
Change in plan assets:
Fair value of plan assets at beginning of year 10,306 8,497 3,488 2,814
Actual return on plan assets 1,788 1,960 414 389
Company contributions 1,034 780 313 279
Benefits paid (947) (931) (181) (180)
Other — — (95) 186
Fair value of plan assets at end of year 12,181 10,306 3,939 3,488
Funded status of plans $ (2,809) $ (3,314) $ (434) $ (778)
Amounts recognized in Consolidated Balance Sheet consist of:
Prepaid pension benefit cost(1) $ — $ — $ 135 $ 58
Accrued pension liability(2) (2,809) (3,314) (569) (836)
Net amount recognized $ (2,809) $ (3,314) $ (434) $ (778)
(1) Included in Other Assets on Consolidated Balance Sheet
(2) Included in Other Liabilities - Non-Current on Consolidated Balance Sheet
96