Honeywell 2010 Annual Report Download - page 87
Download and view the complete annual report
Please find page 87 of the 2010 Honeywell annual report below. You can navigate through the pages in the report by either clicking on the pages listed below, or by using the keyword search tool below to find specific information within the annual report.-
 1
1 -
2
-
3
-
4
-
5
-
6
-
7
-
8
-
9
-
10
-
11
-
12
-
13
-
14
-
15
-
16
-
17
-
18
-
19
-
20
-
21
-
22
-
23
-
24
-
25
-
26
-
27
-
28
-
29
-
30
-
31
-
32
-
33
-
34
-
35
-
36
-
37
-
38
-
39
-
40
-
41
-
42
-
43
-
44
-
45
-
46
-
47
-
48
-
49
-
50
-
51
-
52
-
53
-
54
-
55
-
56
-
57
-
58
-
59
-
60
-
61
-
62
-
63
-
64
-
65
-
66
-
67
-
68
-
69
-
70
-
71
-
72
-
73
-
74
-
75
-
76
-
 77
77 -
 78
78 -
 79
79 -
 80
80 -
 81
81 -
 82
82 -
 83
83 -
 84
84 -
 85
85 -
 86
86 -
 87
87 -
 88
88 -
 89
89 -
 90
90 -
 91
91 -
 92
92 -
 93
93 -
 94
94 -
 95
95 -
 96
96 -
 97
97 -
98
-
99
-
100
-
101
-
102
-
103
-
104
-
105
-
106
-
107
-
108
-
109
-
110
-
111
-
112
-
113
-
114
-
115
-
116
-
117
-
118
-
119
-
120
-
121
-
122
-
123
-
124
-
125
-
126
-
127
-
128
-
129
-
130
-
131
-
132
-
133
-
134
-
135
-
136
-
137
-
138
-
139
-
140
-
141
-
142
-
143
-
144
-
145
-
146
-
147
-
148
-
149
-
150
-
151
-
152
-
153
-
154
-
155
-
156
-
157
-
158
-
159
-
160
-
161
-
162
-
163
-
164
-
165
-
166
-
167
-
168
-
169
-
170
-
171
-
172
-
173
-
174
-
175
-
176
-
177
-
178
-
179
-
180
-
181
-
182
-
183
 |
 |

HONEYWELL INTERNATIONAL INC.
NOTES TO FINANCIAL STATEMENTS—(Continued)
(Dollars in millions, except per share amounts)
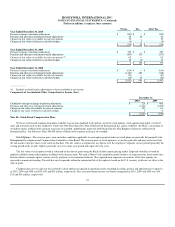
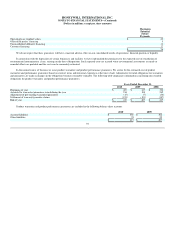
The following table sets forth fair value per share information, including related weighted-average assumptions, used to determine compensation cost:
Years Ended December 31,
2010 2009 2008
Weighted average fair value per share of options granted during the year(1) $ 8.96 $ 6.73 $ 13.81
Assumptions:
Expected annual dividend yield 3.00% 4.26% 1.88%
Expected volatility 29.39% 35.78% 26.35%
Risk-free rate of return 2.64% 2.53% 3.09%
Expected option term (years) 5.4 5.8 5.2
(1) Estimated on date of grant using Black-Scholes option-pricing model.
The following table summarizes information about stock option activity for the three years ended December 31, 2010:
Number of
Options
Weighted
Average
Exercise
Price
Outstanding at December 31, 2007 41,397,369 $ 41.88
Granted 5,024,820 58.46
Exercised (3,577,707) 37.40
Lapsed or canceled (1,910,960) 49.16
Outstanding at December 31, 2008 40,933,522 43.97
Granted 9,159,650 28.40
Exercised (645,201) 31.66
Lapsed or canceled (8,537,598) 53.90
Outstanding at December 31, 2009 40,910,373 38.58
Granted 7,607,950 40.29
Exercised (5,211,526) 34.77
Lapsed or canceled (2,515,266) 44.14
Outstanding at December 31, 2010 40,791,531 $ 39.05
Vested and expected to vest at December 31, 2010(1) 37,802,734 $ 39.19
Exercisable at December 31, 2010 24,722,493 $ 39.43
(1) Represents the sum of vested options of 24.7 million and expected to vest options of 13.1 million. Expected to vest options are derived by applying the
pre-vesting forfeiture rate assumption to total outstanding unvested options 16.1 million.
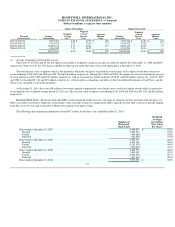
The following table summarizes information about stock options outstanding and exercisable at December 31, 2010:
84