Honeywell 2010 Annual Report Download - page 168
Download and view the complete annual report
Please find page 168 of the 2010 Honeywell annual report below. You can navigate through the pages in the report by either clicking on the pages listed below, or by using the keyword search tool below to find specific information within the annual report.-
 1
1 -
2
-
3
-
4
-
5
-
6
-
7
-
8
-
9
-
10
-
11
-
12
-
13
-
14
-
15
-
16
-
17
-
18
-
19
-
20
-
21
-
22
-
23
-
24
-
25
-
26
-
27
-
28
-
29
-
30
-
31
-
32
-
33
-
34
-
35
-
36
-
37
-
38
-
39
-
40
-
41
-
42
-
43
-
44
-
45
-
46
-
47
-
48
-
49
-
50
-
51
-
52
-
53
-
54
-
55
-
56
-
57
-
58
-
59
-
60
-
61
-
62
-
63
-
64
-
65
-
66
-
67
-
68
-
69
-
70
-
71
-
72
-
73
-
74
-
75
-
76
-
77
-
78
-
79
-
80
-
81
-
82
-
83
-
84
-
85
-
86
-
87
-
88
-
89
-
90
-
91
-
92
-
93
-
94
-
95
-
96
-
97
-
98
-
99
-
100
-
101
-
102
-
103
-
104
-
105
-
106
-
107
-
108
-
109
-
110
-
111
-
112
-
113
-
114
-
115
-
116
-
117
-
118
-
119
-
120
-
121
-
122
-
123
-
124
-
125
-
126
-
127
-
128
-
129
-
130
-
131
-
132
-
133
-
134
-
135
-
136
-
137
-
138
-
139
-
140
-
141
-
142
-
143
-
144
-
145
-
146
-
147
-
148
-
149
-
150
-
151
-
152
-
153
-
154
-
155
-
156
-
157
-
 158
158 -
 159
159 -
 160
160 -
 161
161 -
 162
162 -
 163
163 -
 164
164 -
 165
165 -
 166
166 -
 167
167 -
 168
168 -
 169
169 -
 170
170 -
 171
171 -
 172
172 -
 173
173 -
 174
174 -
 175
175 -
 176
176 -
 177
177 -
 178
178 -
179
-
180
-
181
-
182
-
183
 |
 |
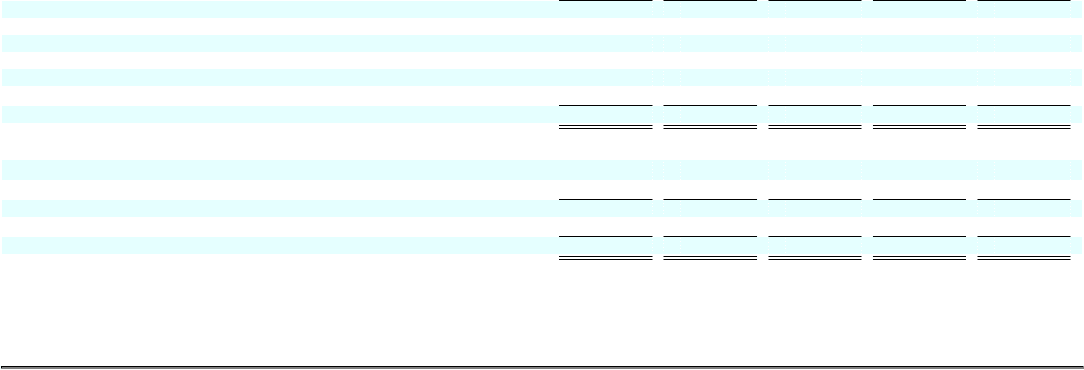
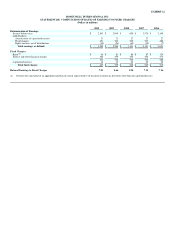
EXHIBIT 12
HONEYWELL INTERNATIONAL INC.
STATEMENT RE: COMPUTATION OF RATIO OF EARNINGS TO FIXED CHARGES
(Dollars in millions)
2010 2009 2008 2007 2006
Determination of Earnings:
Income before taxes $ 2,843 $ 2,049 $ 600 $ 3,576 $ 3,148
Add (Deduct):
Amortization of capitalized interest 21 21 22 22 22
Fixed charges 451 540 542 543 488
Equity income, net of distributions (30) (26) (63) (10) (7)
Total earnings, as defined $ 3,285 $ 2,584 $ 1,101 $ 4,131 $ 3,651
Fixed Charges:
Rents(a) $ 65 $ 81 $ 86 $ 87 $ 114
Interest and other financial charges 386 459 456 456 374
451 540 542 543 488
Capitalized interest 16 15 26 22 22
Total fixed charges $ 467 $ 555 $ 568 $ 565 $ 510
Ratio of Earnings to Fixed Charges 7.03 4.66 1.94 7.31 7.16
(a) Denotes the equivalent of an appropriate portion of rentals representative of the interest factor on all rentals other than for capitalized leases.