Honeywell 2010 Annual Report Download - page 86
Download and view the complete annual report
Please find page 86 of the 2010 Honeywell annual report below. You can navigate through the pages in the report by either clicking on the pages listed below, or by using the keyword search tool below to find specific information within the annual report.-
 1
1 -
2
-
3
-
4
-
5
-
6
-
7
-
8
-
9
-
10
-
11
-
12
-
13
-
14
-
15
-
16
-
17
-
18
-
19
-
20
-
21
-
22
-
23
-
24
-
25
-
26
-
27
-
28
-
29
-
30
-
31
-
32
-
33
-
34
-
35
-
36
-
37
-
38
-
39
-
40
-
41
-
42
-
43
-
44
-
45
-
46
-
47
-
48
-
49
-
50
-
51
-
52
-
53
-
54
-
55
-
56
-
57
-
58
-
59
-
60
-
61
-
62
-
63
-
64
-
65
-
66
-
67
-
68
-
69
-
70
-
71
-
72
-
73
-
74
-
75
-
 76
76 -
 77
77 -
 78
78 -
 79
79 -
 80
80 -
 81
81 -
 82
82 -
 83
83 -
 84
84 -
 85
85 -
 86
86 -
 87
87 -
 88
88 -
 89
89 -
 90
90 -
 91
91 -
 92
92 -
 93
93 -
 94
94 -
 95
95 -
 96
96 -
97
-
98
-
99
-
100
-
101
-
102
-
103
-
104
-
105
-
106
-
107
-
108
-
109
-
110
-
111
-
112
-
113
-
114
-
115
-
116
-
117
-
118
-
119
-
120
-
121
-
122
-
123
-
124
-
125
-
126
-
127
-
128
-
129
-
130
-
131
-
132
-
133
-
134
-
135
-
136
-
137
-
138
-
139
-
140
-
141
-
142
-
143
-
144
-
145
-
146
-
147
-
148
-
149
-
150
-
151
-
152
-
153
-
154
-
155
-
156
-
157
-
158
-
159
-
160
-
161
-
162
-
163
-
164
-
165
-
166
-
167
-
168
-
169
-
170
-
171
-
172
-
173
-
174
-
175
-
176
-
177
-
178
-
179
-
180
-
181
-
182
-
183
 |
 |

HONEYWELL INTERNATIONAL INC.
NOTES TO FINANCIAL STATEMENTS—(Continued)
(Dollars in millions, except per share amounts)
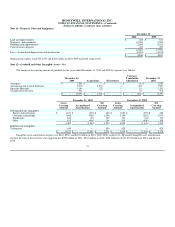
Pretax Tax After Tax
Year Ended December 31, 2010
Foreign exchange translation adjustment $ (249) $ — $ (249)
Pensions and other post retirement benefit adjustments 26 18 44
Changes in fair value of available for sale investments 90 — 90
Changes in fair value of effective cash flow hedges (6) 2 (4)
$ (139) $ 20 $ (119)
Year Ended December 31, 2009
Foreign exchange translation adjustment $ 259 $ — $ 259
Pensions and other post retirement benefit adjustments (407) 136 (271)
Changes in fair value of available for sale investments(1) 112 — 112
Changes in fair value of effective cash flow hedges 38 (8) 30
$ 2 $ 128 $ 130
Year Ended December 31, 2008
Foreign exchange translation adjustment $ (614) $ — $ (614)
Pensions and other post retirement benefit adjustments (1,147) 429 (718)
Changes in fair value of available for sale investments (51) — (51)
Changes in fair value of effective cash flow hedges (40) 16 (24)
$ (1,852) $ 445 $ (1,407)
(1) Includes reclassification adjustment for losses included in net income
Components of Accumulated Other Comprehensive Income (Loss)
December 31,
2010 2009
Cumulative foreign exchange translation adjustment $ 220 $ 468
Pensions and other post retirement benefit adjustments (1,441) (1,485)
Change in fair value of available for sale investments 151 61
Change in fair value of effective cash flow hedges 3 8
$ (1,067) $ (948)
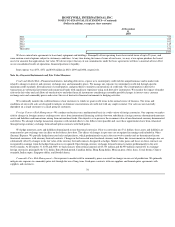
Note 20—Stock-Based Compensation Plans
We have stock-based compensation plans available to grant non-qualified stock options, incentive stock options, stock appreciation rights, restricted
units and restricted stock to key employees. Under the 2006 Stock Incentive Plan of Honeywell International Inc. and its Affiliates (the Plan), a maximum of
43 million shares of Honeywell common stock may be awarded. Additionally, under the 2006 Stock Plan for Non-Employee Directors of Honeywell
International Inc. (the Directors Plan) 500,000 shares of Honeywell common stock may be awarded.
Stock Options—The exercise price, term and other conditions applicable to each option granted under our stock plans are generally determined by the
Management Development and Compensation Committee of the Board. The exercise price of stock options is set on the grant date and may not be less than
the fair market value per share of our stock on that date. The fair value is recognized as an expense over the employee's requisite service period (generally the
vesting period of the award). Options generally vest over a four-year period and expire after ten years.
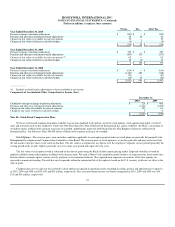
The fair value of each option award is estimated on the date of grant using the Black-Scholes option-pricing model. Expected volatility is based on
implied volatilities from traded options on Honeywell common stock. We used a Monte Carlo simulation model to derive an expected term. Such model uses
historical data to estimate option exercise activity and post-vest termination behavior. The expected term represents an estimate of the time options are
expected to remain outstanding. The risk-free rate for periods within the contractual life of the option is based on the U.S. treasury yield curve in effect at the
time of grant.
Compensation cost on a pre-tax basis related to stock options recognized in operating results (included in selling, general and administrative expenses)
in 2010, 2009 and 2008 was $55, $39 and $51 million, respectively. The associated future income tax benefit recognized in 2010, 2009 and 2008 was $16,
$13 and $19 million, respectively.
83