Honeywell 2010 Annual Report Download - page 36
Download and view the complete annual report
Please find page 36 of the 2010 Honeywell annual report below. You can navigate through the pages in the report by either clicking on the pages listed below, or by using the keyword search tool below to find specific information within the annual report.-
 1
1 -
2
-
3
-
4
-
5
-
6
-
7
-
8
-
9
-
10
-
11
-
12
-
13
-
14
-
15
-
16
-
17
-
18
-
19
-
20
-
21
-
22
-
23
-
24
-
25
-
 26
26 -
 27
27 -
 28
28 -
 29
29 -
 30
30 -
 31
31 -
 32
32 -
 33
33 -
 34
34 -
 35
35 -
 36
36 -
 37
37 -
 38
38 -
 39
39 -
 40
40 -
 41
41 -
 42
42 -
 43
43 -
 44
44 -
 45
45 -
 46
46 -
47
-
48
-
49
-
50
-
51
-
52
-
53
-
54
-
55
-
56
-
57
-
58
-
59
-
60
-
61
-
62
-
63
-
64
-
65
-
66
-
67
-
68
-
69
-
70
-
71
-
72
-
73
-
74
-
75
-
76
-
77
-
78
-
79
-
80
-
81
-
82
-
83
-
84
-
85
-
86
-
87
-
88
-
89
-
90
-
91
-
92
-
93
-
94
-
95
-
96
-
97
-
98
-
99
-
100
-
101
-
102
-
103
-
104
-
105
-
106
-
107
-
108
-
109
-
110
-
111
-
112
-
113
-
114
-
115
-
116
-
117
-
118
-
119
-
120
-
121
-
122
-
123
-
124
-
125
-
126
-
127
-
128
-
129
-
130
-
131
-
132
-
133
-
134
-
135
-
136
-
137
-
138
-
139
-
140
-
141
-
142
-
143
-
144
-
145
-
146
-
147
-
148
-
149
-
150
-
151
-
152
-
153
-
154
-
155
-
156
-
157
-
158
-
159
-
160
-
161
-
162
-
163
-
164
-
165
-
166
-
167
-
168
-
169
-
170
-
171
-
172
-
173
-
174
-
175
-
176
-
177
-
178
-
179
-
180
-
181
-
182
-
183
 |
 |

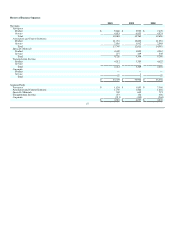
Automation and Control Solutions
2010 2009 Change 2008 Change
Net sales $ 13,749 $ 12,611 9% $ 14,018 (10)%
Cost of products and services sold 9,312 8,561 9,594
Selling, general and administrative expenses 2,480 2,256 2,709
Other 187 206 93
Segment profit $ 1,770 $ 1,588 11% $ 1,622 (2)%
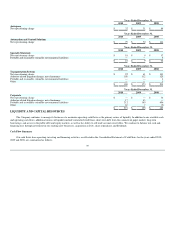
Factors Contributing to Year-Over-Year Change
2010 vs. 2009 2009 vs. 2008
Sales
Segment
Profit Sales
Segment
Profit
Organic growth/ Operational segment profit 6% 9% (9)% 0%
Foreign exchange 0% 0% (4)% (2)%
Acquisitions and divestitures, net 3% 2% 3% 2%
Other 0% 0% 0% (2)%
Total % Change 9% 11% (10)% (2)%
2010 compared with 2009
Automation and Control Solutions ("ACS") sales increased by 9 percent in 2010 compared with 2009, primarily due to a 6 percent increase in organic
revenue driven by increased sales volume and 3 percent growth from acquisitions.
• Sales in our Products businesses increased by 11 percent in 2010 primarily reflecting higher sales volumes in our businesses tied to industrial
production (environmental and combustion controls, sensing and control, gas detection, personal protective equipment and scanning and mobility
products), new product introductions and acquisitions, primarily Sperian.
• Sales in our Solutions businesses increased by 6 percent in 2010 primarily due to the positive impact of increased volume, acquisitions, net of
divestitures (primarily the RMG Group), net of divestitures, higher prices and growth in energy efficiency projects and industrial field solutions
driven by orders growth and conversion to sales from order backlog. Orders and backlog increased in 2010 compared to 2009 primarily driven by
energy efficiency projects, refining and natural gas infrastructure projects and growth in emerging regions.
ACS segment profit increased by 11 percent in 2010 compared with 2009 due to a 9 percent increase in operational segment profit and 2 percent
increase from acquisitions. The increase in operational segment profit is comprised of an approximate 18 percent positive impact from higher sales volume,
partially offset by an approximate 9 percent negative impact from inflation, net of price and productivity (including the absence of prior period labor cost
actions, partially offset by the benefits of prior repositioning). Cost of goods sold totaled $9.3 billion in 2010, an increase of approximately $750 million
which is primarily as a result of the factors discussed above.
2009 compared with 2008
ACS sales decreased by 10 percent in 2009 compared with 2008, primarily due to decreased sales volume (reflecting slower global economic growth)
and an unfavorable impact of foreign exchange of 4 percent, partially offset by a 3 percent growth from acquisitions.
• Sales in our Products businesses decreased by 11 percent, including (i) lower volumes of sales in each of our businesses (excluding the impact of
acquisitions) and (ii) the unfavorable impact of foreign exchange. Softness in residential and industrial end-markets was partially offset by the
positive impact of acquisitions, most significantly Norcross Safety Products.
• Sales in our Solutions businesses decreased by 9 percent primarily due to the unfavorable impact of foreign exchange and volume decreases
largely due to softening demand as a result of customer
33