Honeywell 2010 Annual Report Download - page 108
Download and view the complete annual report
Please find page 108 of the 2010 Honeywell annual report below. You can navigate through the pages in the report by either clicking on the pages listed below, or by using the keyword search tool below to find specific information within the annual report.-
 1
1 -
2
-
3
-
4
-
5
-
6
-
7
-
8
-
9
-
10
-
11
-
12
-
13
-
14
-
15
-
16
-
17
-
18
-
19
-
20
-
21
-
22
-
23
-
24
-
25
-
26
-
27
-
28
-
29
-
30
-
31
-
32
-
33
-
34
-
35
-
36
-
37
-
38
-
39
-
40
-
41
-
42
-
43
-
44
-
45
-
46
-
47
-
48
-
49
-
50
-
51
-
52
-
53
-
54
-
55
-
56
-
57
-
58
-
59
-
60
-
61
-
62
-
63
-
64
-
65
-
66
-
67
-
68
-
69
-
70
-
71
-
72
-
73
-
74
-
75
-
76
-
77
-
78
-
79
-
80
-
81
-
82
-
83
-
84
-
85
-
86
-
87
-
88
-
89
-
90
-
91
-
92
-
93
-
94
-
95
-
96
-
97
-
 98
98 -
 99
99 -
 100
100 -
 101
101 -
 102
102 -
 103
103 -
 104
104 -
 105
105 -
 106
106 -
 107
107 -
 108
108 -
 109
109 -
 110
110 -
 111
111 -
 112
112 -
 113
113 -
 114
114 -
 115
115 -
 116
116 -
 117
117 -
 118
118 -
119
-
120
-
121
-
122
-
123
-
124
-
125
-
126
-
127
-
128
-
129
-
130
-
131
-
132
-
133
-
134
-
135
-
136
-
137
-
138
-
139
-
140
-
141
-
142
-
143
-
144
-
145
-
146
-
147
-
148
-
149
-
150
-
151
-
152
-
153
-
154
-
155
-
156
-
157
-
158
-
159
-
160
-
161
-
162
-
163
-
164
-
165
-
166
-
167
-
168
-
169
-
170
-
171
-
172
-
173
-
174
-
175
-
176
-
177
-
178
-
179
-
180
-
181
-
182
-
183
 |
 |

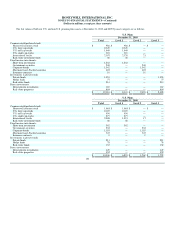
HONEYWELL INTERNATIONAL INC.
NOTES TO FINANCIAL STATEMENTS—(Continued)
(Dollars in millions, except per share amounts
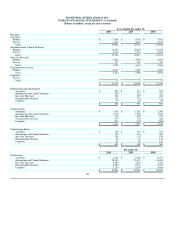
Without Impact of
Medicare Subsidy
Net of
Medicare Subsidy
2011 $ 201 $ 188
2012 187 173
2013 175 161
2014 163 150
2015 153 140
2016-2020 624 564
Employee Savings Plans
We sponsor employee savings plans under which we match, in the form of our common stock, savings plan contributions for certain eligible employees.
Shares issued under the stock match plans were 2.4, 4.8 and 4.9 million at a cost of $105, $158 and $220 million in 2010, 2009, and 2008, respectively.
Note 23. Segment Financial Data
We globally manage our business operations through four reportable operating segments serving customers worldwide with aerospace products and
services, control, sensing and security technologies for buildings, homes and industry, automotive products and chemicals. Segment information is consistent
with how management reviews the businesses, makes investing and resource allocation decisions and assesses operating performance. Our four reportable
segments are as follows:
• Aerospace is organized by customer end-market (Air Transport and Regional, Business and General Aviation and Defense and Space) and
provides products and services which include auxiliary power units; propulsion engines; environmental control systems; electric power systems,
engine controls; repair and overhaul services; flight safety, communications, navigation, radar and surveillance systems; aircraft lighting;
management and technical services; logistic services; advanced systems and instruments; and aircraft wheels and brakes.
• Automation and Control Solutions includes Products (controls for heating, cooling, indoor air quality, ventilation, humidification, lighting and
home automation; advanced software applications for home/building control and optimization; sensors, switches, control systems and instruments
for measuring pressure, air flow, temperature and electrical current; security, fire and gas detection; personal protection equipment; access
control; video surveillance; remote patient monitoring systems; and automatic identification and data collection); Building Solutions (installs,
maintains and upgrades systems that keep buildings safe, comfortable and productive); and Process Solutions (provides a full range of automation
and control solutions for industrial plants, offering advanced software and automation systems that integrate, control and monitor complex
processes in many types of industrial settings as well as equipment that controls, measures and analyzes natural gas production and
transportation).
• Specialty Materials includes fluorocarbons, hydrofluoroolefins, caprolactam, resins, ammonium sulfate for fertilizer, specialty films, waxes,
additives, advanced fibers, customized research chemicals and intermediates, electronic materials and chemicals, catalysts and adsorbents.
• Transportation Systems includes Honeywell Turbo Technologies (turbochargers, charge-air and thermal systems, brake hard parts and other
friction materials); and the Consumer Products Group (car care products including antifreeze, filters, spark plugs, and cleaners, waxes and
additives).
The accounting policies of the segments are the same as those described in Note 1. Honeywell's senior management evaluates segment performance
based on segment profit. Segment profit is measured as business unit income (loss) before taxes excluding general corporate unallocated expense, other
income (expense), interest and other financial charges, pension and other postretirement benefits (expense), stock compensation expense, repositioning and
other charges and accounting changes.
105