Honeywell 2010 Annual Report Download - page 43
Download and view the complete annual report
Please find page 43 of the 2010 Honeywell annual report below. You can navigate through the pages in the report by either clicking on the pages listed below, or by using the keyword search tool below to find specific information within the annual report.-
 1
1 -
2
-
3
-
4
-
5
-
6
-
7
-
8
-
9
-
10
-
11
-
12
-
13
-
14
-
15
-
16
-
17
-
18
-
19
-
20
-
21
-
22
-
23
-
24
-
25
-
26
-
27
-
28
-
29
-
30
-
31
-
32
-
 33
33 -
 34
34 -
 35
35 -
 36
36 -
 37
37 -
 38
38 -
 39
39 -
 40
40 -
 41
41 -
 42
42 -
 43
43 -
 44
44 -
 45
45 -
 46
46 -
 47
47 -
 48
48 -
 49
49 -
 50
50 -
 51
51 -
 52
52 -
 53
53 -
54
-
55
-
56
-
57
-
58
-
59
-
60
-
61
-
62
-
63
-
64
-
65
-
66
-
67
-
68
-
69
-
70
-
71
-
72
-
73
-
74
-
75
-
76
-
77
-
78
-
79
-
80
-
81
-
82
-
83
-
84
-
85
-
86
-
87
-
88
-
89
-
90
-
91
-
92
-
93
-
94
-
95
-
96
-
97
-
98
-
99
-
100
-
101
-
102
-
103
-
104
-
105
-
106
-
107
-
108
-
109
-
110
-
111
-
112
-
113
-
114
-
115
-
116
-
117
-
118
-
119
-
120
-
121
-
122
-
123
-
124
-
125
-
126
-
127
-
128
-
129
-
130
-
131
-
132
-
133
-
134
-
135
-
136
-
137
-
138
-
139
-
140
-
141
-
142
-
143
-
144
-
145
-
146
-
147
-
148
-
149
-
150
-
151
-
152
-
153
-
154
-
155
-
156
-
157
-
158
-
159
-
160
-
161
-
162
-
163
-
164
-
165
-
166
-
167
-
168
-
169
-
170
-
171
-
172
-
173
-
174
-
175
-
176
-
177
-
178
-
179
-
180
-
181
-
182
-
183
 |
 |

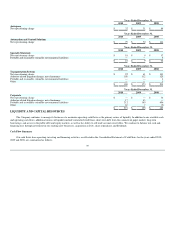
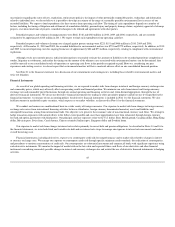
2010 2009 2008
Cash provided by (used for):
Operating activities $ 4,203 $ 3,946 $ 3,791
Investing activities (2,269) (1,133) (2,023)
Financing activities (2,047) (2,152) (1,370)
Effect of exchange rate changes on cash (38) 75 (162)
Net (decrease)/increase in cash and cash equivalents $ (151) $ 736 $ 236
2010 compared with 2009
Cash provided by operating activities increased by $257 million during 2010 compared with 2009 primarily due to i) increased accrued expenses of
$690 million (due to increased customer advances and incentive compensation accruals), ii) a $550 million impact from increased deferred taxes (excluding
the impact of cash taxes), iii) increased net income of $474 million, iv) lower cash tax payments of approximately $300 million and v) a $219 million
decrease in payments for repositioning and other charges, partially offset by a i) $1,059 unfavorable impact from working capital driven by higher receivables
and increased purchases of raw materials and component inventory to support higher demand, partially offset by a corresponding increase to accounts
payable, ii) increased pension and other postretirement payments of $598 million and iii) the absence of $155 million sale of long-term receivables in 2009.
Cash used for investing activities increased by $1,136 million during 2010 compared with 2009 primarily due to an increase in cash paid for
acquisitions of $835 million (most significantly Sperian Protection, discussed below), and a net $341 million increase in investments in short-term marketable
securities.
Cash used for financing activities decreased by $105 million during 2010 compared to the 2009 primarily due to a decrease in the net repayment of debt
(including commercial paper) of $287 million and an increase in the proceeds from the issuance of common stock, primarily related to stock option exercises
of $158 million, partially offset by the repayment of $326 million of debt assumed in the acquisition of Sperian Protection (see below).
2009 compared with 2008
Cash provided by operating activities increased by $155 million during 2009 compared with 2008 primarily due to i) a favorable impact from working
capital of $577 million (primarily due to a decrease in inventory of $479 million driven by reduced purchases of raw material and component inventory, lower
production of finished goods in line with decreased sales volumes and inventory reduction initiatives across each of our segments), ii) lower cash tax
payments of $449 million, iii) $155 million from the sale of long term receivables, iv) increased net income of $742 million and v) a $718 million impact
from increased deferred income taxes (excluding the impact of cash tax payments noted above), partially offset by i) decreased pension expense of $2,312
million, ii) receipts from the sale of insurance receivables of $82 million in 2008, iii) a $56 million decreased impact from other current assets (most
significantly lower receipts from insurance receivables) and iv) higher repositioning payments of $43 million.
Cash used for investing activities decreased by $890 million during 2009 compared with 2008 primarily due to a $1,713 million decrease in cash paid
for acquisitions (most significantly the acquisition of Norcross and Metrolgic in 2008) and a $275 million decrease in expenditures for property, plant, and
equipment, partially offset by a $908 million decrease in proceeds from sales of businesses (most significantly the divestiture of Consumables Solutions in
2008).
Cash used for financing activities increased by $782 million during 2009 compared with 2008 primarily due to a net repayment of debt (including
commercial paper) in 2009 of $1,272 million compared to net proceeds (including commercial paper) of $733 million in 2008 partially offset by a decrease in
repurchases of common stock of $1,459 million.
Liquidity
Each of our businesses is focused on implementing strategies to improve working capital turnover in 2011 to increase operating cash flows. Considering
the current economic environment in which each of our businesses operate and our business plans and strategies, including our focus on growth, cost
reduction and productivity
40