Honeywell 2010 Annual Report Download - page 82
Download and view the complete annual report
Please find page 82 of the 2010 Honeywell annual report below. You can navigate through the pages in the report by either clicking on the pages listed below, or by using the keyword search tool below to find specific information within the annual report.-
 1
1 -
2
-
3
-
4
-
5
-
6
-
7
-
8
-
9
-
10
-
11
-
12
-
13
-
14
-
15
-
16
-
17
-
18
-
19
-
20
-
21
-
22
-
23
-
24
-
25
-
26
-
27
-
28
-
29
-
30
-
31
-
32
-
33
-
34
-
35
-
36
-
37
-
38
-
39
-
40
-
41
-
42
-
43
-
44
-
45
-
46
-
47
-
48
-
49
-
50
-
51
-
52
-
53
-
54
-
55
-
56
-
57
-
58
-
59
-
60
-
61
-
62
-
63
-
64
-
65
-
66
-
67
-
68
-
69
-
70
-
71
-
 72
72 -
 73
73 -
 74
74 -
 75
75 -
 76
76 -
 77
77 -
 78
78 -
 79
79 -
 80
80 -
 81
81 -
 82
82 -
 83
83 -
 84
84 -
 85
85 -
 86
86 -
 87
87 -
 88
88 -
 89
89 -
 90
90 -
 91
91 -
 92
92 -
93
-
94
-
95
-
96
-
97
-
98
-
99
-
100
-
101
-
102
-
103
-
104
-
105
-
106
-
107
-
108
-
109
-
110
-
111
-
112
-
113
-
114
-
115
-
116
-
117
-
118
-
119
-
120
-
121
-
122
-
123
-
124
-
125
-
126
-
127
-
128
-
129
-
130
-
131
-
132
-
133
-
134
-
135
-
136
-
137
-
138
-
139
-
140
-
141
-
142
-
143
-
144
-
145
-
146
-
147
-
148
-
149
-
150
-
151
-
152
-
153
-
154
-
155
-
156
-
157
-
158
-
159
-
160
-
161
-
162
-
163
-
164
-
165
-
166
-
167
-
168
-
169
-
170
-
171
-
172
-
173
-
174
-
175
-
176
-
177
-
178
-
179
-
180
-
181
-
182
-
183
 |
 |
HONEYWELL INTERNATIONAL INC.
NOTES TO FINANCIAL STATEMENTS—(Continued)
(Dollars in millions, except per share amounts)
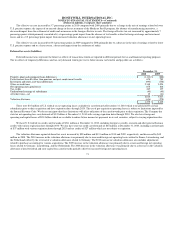
We also enter into forward commodity contracts with third parties designated as hedges of anticipated purchases of several commodities. Forward commodity
contracts are marked-to-market, with the resulting gains and losses recognized in earnings when the hedged transaction is recognized. At December 31, 2010
and 2009, we had contracts with notional amounts of $23 million and $52 million respectively related to forward commodity agreements, principally base
metals and natural gas.
Interest Rate Risk Management— We use a combination of financial instruments, including long-term, medium-term and short-term financing, variable-
rate commercial paper, and interest rate swaps to manage the interest rate mix of our total debt portfolio and related overall cost of borrowing. At December
31, 2010 and 2009, interest rate swap agreements designated as fair value hedges effectively changed $600 million of fixed rate debt at a rate of 3.875 percent
to LIBOR based floating debt. Our interest rate swaps mature in 2014.
Fair Value of Financial Instruments— The FASB's accounting guidance defines fair value as the price that would be received to sell an asset or paid to
transfer a liability in an orderly transaction between market participants at the measurement date (exit price). The FASB's guidance classifies the inputs used
to measure fair value into the following hierarchy:
Level 1 Unadjusted quoted prices in active markets for identical assets or liabilities
Level 2 Unadjusted quoted prices in active markets for similar assets or liabilities, or
Unadjusted quoted prices for identical or similar assets or liabilities in markets that are not active, or
Inputs other than quoted prices that are observable for the asset or liability
Level 3 Unobservable inputs for the asset or liability
The Company endeavors to utilize the best available information in measuring fair value. Financial and nonfinancial assets and liabilities are classified
in their entirety based on the lowest level of input that is significant to the fair value measurement. The Company has determined that our available for sale
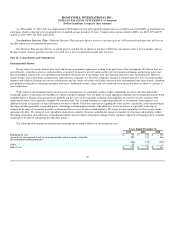
investments are level 1 and our remaining financial assets and liabilities are level 2 in the fair value hierarchy. The following table sets forth the Company's
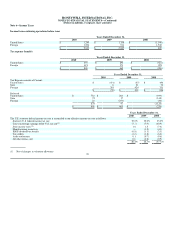
financial assets and liabilities that were accounted for at fair value on a recurring basis as of December 31, 2010 and 2009:
December 31,
2010 2009
Assets:
Foreign currency exchange contracts $ 16 $ 11
Available for sale investments 322 141
Interest rate swap agreements 22 1
Forward commodity contracts 2 4
Liabilities:
Foreign currency exchange contracts $ 14 $ 3
Interest rate swap agreements — 3
Forward commodity contracts 2 —
The foreign currency exchange contracts, interest rate swap agreements, and forward commodity contracts are valued using broker quotations, or
market transactions in either the listed or over-the-counter markets. As such, these derivative instruments are classified within level 2. The Company also
holds investments in marketable equity securities, commercial paper, certificates of deposits, and time deposits that are designated as available for sale and are
valued using market transactions in over-the-counter markets. As such, these investments are classified within level 2.
79