Honeywell 2010 Annual Report Download - page 109
Download and view the complete annual report
Please find page 109 of the 2010 Honeywell annual report below. You can navigate through the pages in the report by either clicking on the pages listed below, or by using the keyword search tool below to find specific information within the annual report.-
 1
1 -
2
-
3
-
4
-
5
-
6
-
7
-
8
-
9
-
10
-
11
-
12
-
13
-
14
-
15
-
16
-
17
-
18
-
19
-
20
-
21
-
22
-
23
-
24
-
25
-
26
-
27
-
28
-
29
-
30
-
31
-
32
-
33
-
34
-
35
-
36
-
37
-
38
-
39
-
40
-
41
-
42
-
43
-
44
-
45
-
46
-
47
-
48
-
49
-
50
-
51
-
52
-
53
-
54
-
55
-
56
-
57
-
58
-
59
-
60
-
61
-
62
-
63
-
64
-
65
-
66
-
67
-
68
-
69
-
70
-
71
-
72
-
73
-
74
-
75
-
76
-
77
-
78
-
79
-
80
-
81
-
82
-
83
-
84
-
85
-
86
-
87
-
88
-
89
-
90
-
91
-
92
-
93
-
94
-
95
-
96
-
97
-
98
-
 99
99 -
 100
100 -
 101
101 -
 102
102 -
 103
103 -
 104
104 -
 105
105 -
 106
106 -
 107
107 -
 108
108 -
 109
109 -
 110
110 -
 111
111 -
 112
112 -
 113
113 -
 114
114 -
 115
115 -
 116
116 -
 117
117 -
 118
118 -
 119
119 -
120
-
121
-
122
-
123
-
124
-
125
-
126
-
127
-
128
-
129
-
130
-
131
-
132
-
133
-
134
-
135
-
136
-
137
-
138
-
139
-
140
-
141
-
142
-
143
-
144
-
145
-
146
-
147
-
148
-
149
-
150
-
151
-
152
-
153
-
154
-
155
-
156
-
157
-
158
-
159
-
160
-
161
-
162
-
163
-
164
-
165
-
166
-
167
-
168
-
169
-
170
-
171
-
172
-
173
-
174
-
175
-
176
-
177
-
178
-
179
-
180
-
181
-
182
-
183
 |
 |

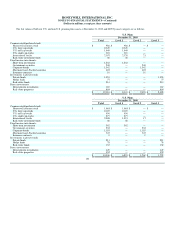
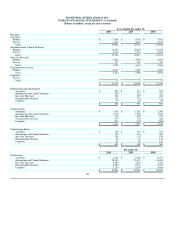
HONEYWELL INTERNATIONAL INC.
NOTES TO FINANCIAL STATEMENTS—(Continued)
(Dollars in millions, except per share amounts
Years Ended December 31,
2010 2009 2008
Net Sales
Aerospace
Product $ 5,868 $ 5,930 $ 7,676
Service 4,815 4,833 4,974
Total 10,683 10,763 12,650
Automation and Control Solutions
Product 11,733 10,699 11,953
Service 2,016 1,912 2,065
Total 13,749 12,611 14,018
Specialty Materials
Product 4,449 3,895 4,961
Service 277 249 305
Total 4,726 4,144 5,266
Transportation Systems
Product 4,212 3,389 4,622
Total 4,212 3,389 4,622
Corporate
Service — 1 —
Total — 1 —
$ 33,370 $ 30,908 $ 36,556
Depreciation and amortization
Aerospace $ 224 $ 217 $ 202
Automation and Control Solutions 368 352 321
Specialty Materials 222 209 208
Transportation Systems 114 119 122
Corporate 59 60 50
$ 987 $ 957 $ 903
Segment Profit
Aerospace $ 1,835 $ 1,893 $ 2,300
Automation and Control Solutions 1,770 1,588 1,622
Specialty Materials 749 605 721
Transportation Systems 473 156 406
Corporate (211) (145) (204)
$ 4,616 $ 4,097 $ 4,845
Capital expenditures
Aerospace $ 158 $ 184 $ 246
Automation and Control Solutions 131 114 208
Specialty Materials 188 153 194
Transportation Systems 85 70 110
Corporate 89 88 126
$ 651 $ 609 $ 884
December 31,
2010 2009 2008
Total Assets
Aerospace $ 8,604 $ 8,386 $ 8,476
Automation and Control Solutions 18,183 15,474 14,609
Specialty Materials 4,938 4,657 5,232
Transportation Systems 2,985 2,772 2,787
Corporate 3,124 4,704 4,466
$ 37,834 $ 35,993 $ 35,570
106