Honeywell 2010 Annual Report Download - page 64
Download and view the complete annual report
Please find page 64 of the 2010 Honeywell annual report below. You can navigate through the pages in the report by either clicking on the pages listed below, or by using the keyword search tool below to find specific information within the annual report.-
 1
1 -
2
-
3
-
4
-
5
-
6
-
7
-
8
-
9
-
10
-
11
-
12
-
13
-
14
-
15
-
16
-
17
-
18
-
19
-
20
-
21
-
22
-
23
-
24
-
25
-
26
-
27
-
28
-
29
-
30
-
31
-
32
-
33
-
34
-
35
-
36
-
37
-
38
-
39
-
40
-
41
-
42
-
43
-
44
-
45
-
46
-
47
-
48
-
49
-
50
-
51
-
52
-
53
-
 54
54 -
 55
55 -
 56
56 -
 57
57 -
 58
58 -
 59
59 -
 60
60 -
 61
61 -
 62
62 -
 63
63 -
 64
64 -
 65
65 -
 66
66 -
 67
67 -
 68
68 -
 69
69 -
 70
70 -
 71
71 -
 72
72 -
 73
73 -
 74
74 -
75
-
76
-
77
-
78
-
79
-
80
-
81
-
82
-
83
-
84
-
85
-
86
-
87
-
88
-
89
-
90
-
91
-
92
-
93
-
94
-
95
-
96
-
97
-
98
-
99
-
100
-
101
-
102
-
103
-
104
-
105
-
106
-
107
-
108
-
109
-
110
-
111
-
112
-
113
-
114
-
115
-
116
-
117
-
118
-
119
-
120
-
121
-
122
-
123
-
124
-
125
-
126
-
127
-
128
-
129
-
130
-
131
-
132
-
133
-
134
-
135
-
136
-
137
-
138
-
139
-
140
-
141
-
142
-
143
-
144
-
145
-
146
-
147
-
148
-
149
-
150
-
151
-
152
-
153
-
154
-
155
-
156
-
157
-
158
-
159
-
160
-
161
-
162
-
163
-
164
-
165
-
166
-
167
-
168
-
169
-
170
-
171
-
172
-
173
-
174
-
175
-
176
-
177
-
178
-
179
-
180
-
181
-
182
-
183
 |
 |

HONEYWELL INTERNATIONAL INC.
NOTES TO FINANCIAL STATEMENTS—(Continued)
(Dollars in millions, except per share amounts)
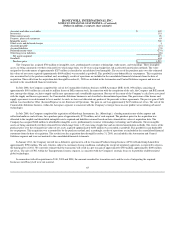
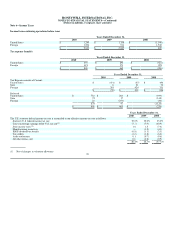
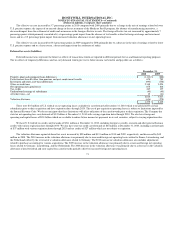
Consolidated Statement of Shareowners Equity
Year Ended December 31, 2009
Previously
Reported Revised Effect of
Change
Retained earnings
Beginning balance 16,250 13,391 (2,859)
Net income attributable to Honeywell 2,153 1,548 (605)
Ending balance 17,487 14,023 (3,464)
Accumulated other comprehensive income (loss)
Beginning balance (3,809) (1,078) 2,731
Pensions and other post retirement benefit adjustments (1,021) (271) 750
Ending balance (4,429) (948) 3,481
Total shareowners equity 8,954 8,971 17
Comprehensive income
Net income 2,189 1,584 (605)
Pensions and other post retirement benefit adjustments (1,021) (271) 750
Total comprehensive income 1,569 1,714 145
Comprehensive income (loss) attributable to Honeywell 1,533 1,678 145
Year Ended December 31, 2008
Previously
Reported Revised Effect of
Change
Retained earnings
Beginning balance 14,273 13,400 (873)
Net income attributable to Honeywell 2,792 806 (1,986)
Ending balance 16,250 13,391 (2,859)
Accumulated other comprehensive income (loss)
Beginning balance (544) 329 873
Pensions and other post retirement benefit adjustments (2,576) (718) 1,858
Ending balance (3,809) (1,078) 2,731
Total shareowners equity 7,269 7,141 (128)
Comprehensive income
Net income 2,812 826 (1,986)
Pensions and other post retirement benefit adjustments (2,576) (718) 1,858
Total comprehensive income (453) (581) (128)
Comprehensive income (loss) attributable to Honeywell (473) (601) (128)
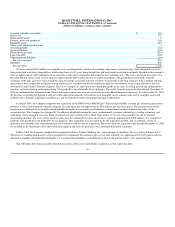
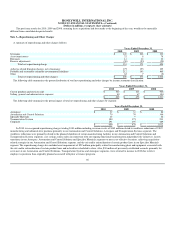
Foreign Currency Translation—Assets and liabilities of subsidiaries operating outside the United States with a functional currency other than U.S.
dollars are translated into U.S. dollars using year-end exchange rates. Sales, costs and expenses are translated at the average exchange rates in effect during
the year. Foreign currency translation gains and losses are included as a component of Accumulated Other Comprehensive Income (Loss). For subsidiaries
operating in highly inflationary environments, inventories and property, plant and equipment, including related expenses, are remeasured at the exchange rate
in effect on the date the assets were acquired, while monetary assets and liabilities are remeasured at year-end exchange rates. Remeasurement adjustments for
these subsidiaries are included in earnings.
Derivative Financial Instruments—As a result of our global operating and financing activities, we are exposed to market risks from changes in interest
and foreign currency exchange rates and commodity prices, which may adversely affect our operating results and financial position. We minimize our risks
from interest and foreign currency exchange rate and commodity price fluctuations through our normal operating and financing activities and, when deemed
appropriate through the use of derivative financial instruments. Derivative financial instruments are used to manage risk and are not used for trading or other
speculative purposes and we do not use leveraged derivative financial instruments. Derivative financial instruments used for hedging purposes must be
designated and effective as a hedge of the identified risk exposure at the inception of the contract.
61