Honeywell 2010 Annual Report Download - page 97
Download and view the complete annual report
Please find page 97 of the 2010 Honeywell annual report below. You can navigate through the pages in the report by either clicking on the pages listed below, or by using the keyword search tool below to find specific information within the annual report.-
 1
1 -
2
-
3
-
4
-
5
-
6
-
7
-
8
-
9
-
10
-
11
-
12
-
13
-
14
-
15
-
16
-
17
-
18
-
19
-
20
-
21
-
22
-
23
-
24
-
25
-
26
-
27
-
28
-
29
-
30
-
31
-
32
-
33
-
34
-
35
-
36
-
37
-
38
-
39
-
40
-
41
-
42
-
43
-
44
-
45
-
46
-
47
-
48
-
49
-
50
-
51
-
52
-
53
-
54
-
55
-
56
-
57
-
58
-
59
-
60
-
61
-
62
-
63
-
64
-
65
-
66
-
67
-
68
-
69
-
70
-
71
-
72
-
73
-
74
-
75
-
76
-
77
-
78
-
79
-
80
-
81
-
82
-
83
-
84
-
85
-
86
-
 87
87 -
 88
88 -
 89
89 -
 90
90 -
 91
91 -
 92
92 -
 93
93 -
 94
94 -
 95
95 -
 96
96 -
 97
97 -
 98
98 -
 99
99 -
 100
100 -
 101
101 -
 102
102 -
 103
103 -
 104
104 -
 105
105 -
 106
106 -
 107
107 -
108
-
109
-
110
-
111
-
112
-
113
-
114
-
115
-
116
-
117
-
118
-
119
-
120
-
121
-
122
-
123
-
124
-
125
-
126
-
127
-
128
-
129
-
130
-
131
-
132
-
133
-
134
-
135
-
136
-
137
-
138
-
139
-
140
-
141
-
142
-
143
-
144
-
145
-
146
-
147
-
148
-
149
-
150
-
151
-
152
-
153
-
154
-
155
-
156
-
157
-
158
-
159
-
160
-
161
-
162
-
163
-
164
-
165
-
166
-
167
-
168
-
169
-
170
-
171
-
172
-
173
-
174
-
175
-
176
-
177
-
178
-
179
-
180
-
181
-
182
-
183
 |
 |

HONEYWELL INTERNATIONAL INC.
NOTES TO FINANCIAL STATEMENTS—(Continued)
(Dollars in millions, except per share amounts)
Maximum
Potential
Future
Payments
Operating lease residual values $ 43
Other third parties' financing 5
Unconsolidated affiliates' financing 11
Customer financing 17
$ 76
We do not expect that these guarantees will have a material adverse effect on our consolidated results of operations, financial position or liquidity.
In connection with the disposition of certain businesses and facilities we have indemnified the purchasers for the expected cost of remediation of
environmental contamination, if any, existing on the date of disposition. Such expected costs are accrued when environmental assessments are made or
remedial efforts are probable and the costs can be reasonably estimated.
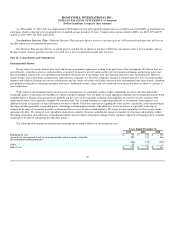
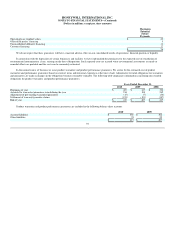
In the normal course of business we issue product warranties and product performance guarantees. We accrue for the estimated cost of product
warranties and performance guarantees based on contract terms and historical experience at the time of sale. Adjustments to initial obligations for warranties
and guarantees are made as changes in the obligations become reasonably estimable. The following table summarizes information concerning our recorded
obligations for product warranties and product performance guarantees:
Years Ended December 31,
2010 2009 2008
Beginning of year $ 407 $ 417 $ 396
Accruals for warranties/guarantees issued during the year 214 188 242
Adjustment of pre-existing warranties/guarantees (13) (7) (34)
Settlement of warranty/guarantee claims (193) (191) (187)
End of year $ 415 $ 407 $ 417
Product warranties and product performance guarantees are included in the following balance sheet accounts:
2010 2009
Accrued liabilities $ 380 $ 382
Other liabilities 35 25
$ 415 $ 407
94