Honeywell 2010 Annual Report Download - page 40
Download and view the complete annual report
Please find page 40 of the 2010 Honeywell annual report below. You can navigate through the pages in the report by either clicking on the pages listed below, or by using the keyword search tool below to find specific information within the annual report.-
 1
1 -
2
-
3
-
4
-
5
-
6
-
7
-
8
-
9
-
10
-
11
-
12
-
13
-
14
-
15
-
16
-
17
-
18
-
19
-
20
-
21
-
22
-
23
-
24
-
25
-
26
-
27
-
28
-
29
-
 30
30 -
 31
31 -
 32
32 -
 33
33 -
 34
34 -
 35
35 -
 36
36 -
 37
37 -
 38
38 -
 39
39 -
 40
40 -
 41
41 -
 42
42 -
 43
43 -
 44
44 -
 45
45 -
 46
46 -
 47
47 -
 48
48 -
 49
49 -
 50
50 -
51
-
52
-
53
-
54
-
55
-
56
-
57
-
58
-
59
-
60
-
61
-
62
-
63
-
64
-
65
-
66
-
67
-
68
-
69
-
70
-
71
-
72
-
73
-
74
-
75
-
76
-
77
-
78
-
79
-
80
-
81
-
82
-
83
-
84
-
85
-
86
-
87
-
88
-
89
-
90
-
91
-
92
-
93
-
94
-
95
-
96
-
97
-
98
-
99
-
100
-
101
-
102
-
103
-
104
-
105
-
106
-
107
-
108
-
109
-
110
-
111
-
112
-
113
-
114
-
115
-
116
-
117
-
118
-
119
-
120
-
121
-
122
-
123
-
124
-
125
-
126
-
127
-
128
-
129
-
130
-
131
-
132
-
133
-
134
-
135
-
136
-
137
-
138
-
139
-
140
-
141
-
142
-
143
-
144
-
145
-
146
-
147
-
148
-
149
-
150
-
151
-
152
-
153
-
154
-
155
-
156
-
157
-
158
-
159
-
160
-
161
-
162
-
163
-
164
-
165
-
166
-
167
-
168
-
169
-
170
-
171
-
172
-
173
-
174
-
175
-
176
-
177
-
178
-
179
-
180
-
181
-
182
-
183
 |
 |

Transportation system
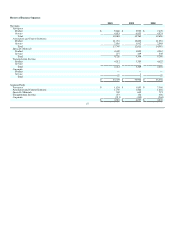
2010 2009 Change 2008 Change
Net sales $ 4,212 $ 3,389 24% $ 4,622 (27)%
Cost of products and services sold 3,433 2,928 3,847
Selling, general and administrative expenses 246 252 323
Other 60 53 46
Segment profit $ 473 $ 156 203% $ 406 (62)%
Factors Contributing to Year-Over-Year Change
2010 vs. 2009 2009 vs. 2008
Sales
Segment
Profit Sales
Segment
Profit
Organic growth/ Operational segment profit 25% 206% (24)% (58)%
Foreign exchange (1)% (3)% (3)% (4)%
Total % Change 24% 203% (27)% (62)%
2010 compared with 2009
Transportation Systems sales increased by 24 percent in 2010 compared with the 2009 primarily due to a 25 percent increase in organic revenue driven
by increased sales volume, partially offset by an unfavorable impact of foreign exchange of 1 percent.
• Turbo Technologies sales increased 31 percent primarily due to increased turbocharger sales to both light vehicle and commercial vehicle engine
manufacturers partially offset by the negative impacts of foreign exchange. We expect increased volume to continue in 2011 as we benefit from
new platform launches and continued strong diesel penetration rates in Western Europe.
• Consumer Products Group ("CPG") sales increased 7 percent, primarily due to higher prices (primarily pass through of ethylene glycol cost
increases) and higher volume of antifreeze products in the fourth quarter.
Transportation Systems segment profit increased by $317 million in 2010 compared with 2009 predominantly due to the positive impact from increased
sales volume. Cost of goods sold totaled $3.4 billion in 2010, an increase of approximately $500 million which is also primarily a result of increased sales
volume.
2009 compared with 2008
Transportation Systems sales decreased by 27 percent in 2009 compared with the 2008, primarily due to lower volumes (driven by the ongoing
challenging global automotive industry conditions) and the negative impact of foreign exchange in the first nine months of 2009.
• Turbo Technologies sales, including Friction Materials, decreased by 32 percent primarily due to lower sales volumes to both our commercial
and light vehicle engine manufacturing customers and the negative impact of foreign exchange. Diesel penetration rates in Western Europe
declined in the first nine months of 2009 and there was a shift in consumer preference towards lower displacement engines. Full year 2009 sales
decline was partially offset by a 19 percent sales increase during the fourth quarter primarily due to the positive impact of foreign exchange and
higher sales volumes to our light vehicle engine manufacturing customers.
• CPG sales decreased by 8 percent primarily due to lower prices (primarily pass through of ethylene glycol cost decreases), lower volumes, and
the negative impact of foreign exchange.
Transportation Systems segment profit decreased by $ 250 million in 2009 compared with 2008 due principally to lower sales volume as a result of the
factors discussed above partially offset by lower material costs, reduced labor costs (reflecting reduced census, work schedule reductions, benefits from prior
repositioning actions and lower incentive compensation) and the positive impact of indirect cost savings initiatives. In the fourth
37