Honeywell 2010 Annual Report Download - page 69
Download and view the complete annual report
Please find page 69 of the 2010 Honeywell annual report below. You can navigate through the pages in the report by either clicking on the pages listed below, or by using the keyword search tool below to find specific information within the annual report.-
 1
1 -
2
-
3
-
4
-
5
-
6
-
7
-
8
-
9
-
10
-
11
-
12
-
13
-
14
-
15
-
16
-
17
-
18
-
19
-
20
-
21
-
22
-
23
-
24
-
25
-
26
-
27
-
28
-
29
-
30
-
31
-
32
-
33
-
34
-
35
-
36
-
37
-
38
-
39
-
40
-
41
-
42
-
43
-
44
-
45
-
46
-
47
-
48
-
49
-
50
-
51
-
52
-
53
-
54
-
55
-
56
-
57
-
58
-
 59
59 -
 60
60 -
 61
61 -
 62
62 -
 63
63 -
 64
64 -
 65
65 -
 66
66 -
 67
67 -
 68
68 -
 69
69 -
 70
70 -
 71
71 -
 72
72 -
 73
73 -
 74
74 -
 75
75 -
 76
76 -
 77
77 -
 78
78 -
 79
79 -
80
-
81
-
82
-
83
-
84
-
85
-
86
-
87
-
88
-
89
-
90
-
91
-
92
-
93
-
94
-
95
-
96
-
97
-
98
-
99
-
100
-
101
-
102
-
103
-
104
-
105
-
106
-
107
-
108
-
109
-
110
-
111
-
112
-
113
-
114
-
115
-
116
-
117
-
118
-
119
-
120
-
121
-
122
-
123
-
124
-
125
-
126
-
127
-
128
-
129
-
130
-
131
-
132
-
133
-
134
-
135
-
136
-
137
-
138
-
139
-
140
-
141
-
142
-
143
-
144
-
145
-
146
-
147
-
148
-
149
-
150
-
151
-
152
-
153
-
154
-
155
-
156
-
157
-
158
-
159
-
160
-
161
-
162
-
163
-
164
-
165
-
166
-
167
-
168
-
169
-
170
-
171
-
172
-
173
-
174
-
175
-
176
-
177
-
178
-
179
-
180
-
181
-
182
-
183
 |
 |

HONEYWELL INTERNATIONAL INC.
NOTES TO FINANCIAL STATEMENTS—(Continued)
(Dollars in millions, except per share amounts)
The pro forma results for 2010, 2009 and 2008, assuming these acquisitions had been made at the beginning of the year, would not be materially
different from consolidated reported results.
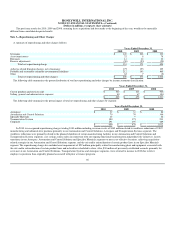
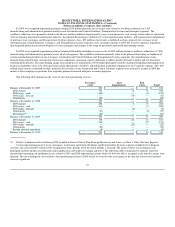
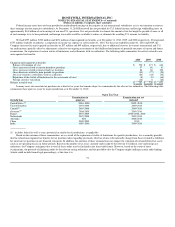
Note 3—Repositioning and Other Charges
A summary of repositioning and other charges follows:
Years Ended December 31,
2010 2009 2008
Severance $ 145 $ 206 $ 333
Asset impairments 22 8 78
Exit costs 14 10 33
Reserve adjustments (30) (53) (20)
Total net repositioning charge 151 171 424
Asbestos related litigation charges, net of insurance 175 155 125
Probable and reasonably estimable environmental liabilities 212 145 465
Other 62 7 (2)
Total net repositioning and other charges $ 600 $ 478 $ 1,012
The following table summarizes the pretax distribution of total net repositioning and other charges by income statement classification:
Years Ended December 31,
2010 2009 2008
Cost of products and services sold $ 560 $ 411 $ 908
Selling, general and administrative expenses 40 67 104
$ 600 $ 478 $ 1,012
The following table summarizes the pretax impact of total net repositioning and other charges by segment:
Years Ended December 31,
2010 2009 2008
Aerospace $ 32 $ 31 $ 84
Automation and Control Solutions 79 70 164
Specialty Materials 18 9 42
Transportation Systems 180 173 233
Corporate 291 195 489
$ 600 $ 478 $ 1,012
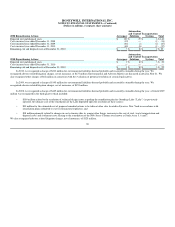
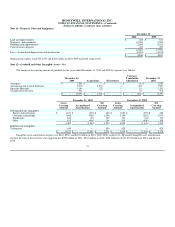
In 2010, we recognized repositioning charges totaling $181 million including severance costs of $145 million related to workforce reductions of 2,807
manufacturing and administrative positions primarily in our Automation and Control Solutions, Aerospace and Transportation Systems segments. The
workforce reductions were primarily related to the planned shutdown of certain manufacturing facilities in our Automation and Control Solutions and
Transportation Systems segments, cost savings actions taken in connection with our ongoing functional transformation and productivity initiatives, factory
transitions in our Aerospace, Automation and Control Solutions and Specialty Materials segments to more cost-effective locations, achieving acquisition-
related synergies in our Automation and Control Solutions segment, and the exit and/or rationalization of certain product lines in our Specialty Materials
segment. The repositioning charge also included asset impairments of $22 million principally related to manufacturing plant and equipment associated with
the exit and/or rationalization of certain product lines and in facilities scheduled to close. Also, $30 million of previously established accruals, primarily for
severance at our Automation and Control Solutions, Transportation Systems and Aerospace segments, were returned to income in 2010 due to fewer
employee separations than originally planned associated with prior severance programs.
66