Honeywell 2010 Annual Report Download - page 77
Download and view the complete annual report
Please find page 77 of the 2010 Honeywell annual report below. You can navigate through the pages in the report by either clicking on the pages listed below, or by using the keyword search tool below to find specific information within the annual report.-
 1
1 -
2
-
3
-
4
-
5
-
6
-
7
-
8
-
9
-
10
-
11
-
12
-
13
-
14
-
15
-
16
-
17
-
18
-
19
-
20
-
21
-
22
-
23
-
24
-
25
-
26
-
27
-
28
-
29
-
30
-
31
-
32
-
33
-
34
-
35
-
36
-
37
-
38
-
39
-
40
-
41
-
42
-
43
-
44
-
45
-
46
-
47
-
48
-
49
-
50
-
51
-
52
-
53
-
54
-
55
-
56
-
57
-
58
-
59
-
60
-
61
-
62
-
63
-
64
-
65
-
66
-
 67
67 -
 68
68 -
 69
69 -
 70
70 -
 71
71 -
 72
72 -
 73
73 -
 74
74 -
 75
75 -
 76
76 -
 77
77 -
 78
78 -
 79
79 -
 80
80 -
 81
81 -
 82
82 -
 83
83 -
 84
84 -
 85
85 -
 86
86 -
 87
87 -
88
-
89
-
90
-
91
-
92
-
93
-
94
-
95
-
96
-
97
-
98
-
99
-
100
-
101
-
102
-
103
-
104
-
105
-
106
-
107
-
108
-
109
-
110
-
111
-
112
-
113
-
114
-
115
-
116
-
117
-
118
-
119
-
120
-
121
-
122
-
123
-
124
-
125
-
126
-
127
-
128
-
129
-
130
-
131
-
132
-
133
-
134
-
135
-
136
-
137
-
138
-
139
-
140
-
141
-
142
-
143
-
144
-
145
-
146
-
147
-
148
-
149
-
150
-
151
-
152
-
153
-
154
-
155
-
156
-
157
-
158
-
159
-
160
-
161
-
162
-
163
-
164
-
165
-
166
-
167
-
168
-
169
-
170
-
171
-
172
-
173
-
174
-
175
-
176
-
177
-
178
-
179
-
180
-
181
-
182
-
183
 |
 |

HONEYWELL INTERNATIONAL INC.
NOTES TO FINANCIAL STATEMENTS—(Continued)
(Dollars in millions, except per share amounts)
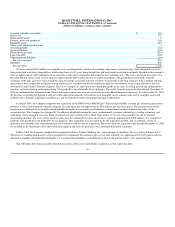
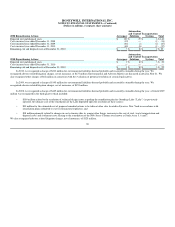
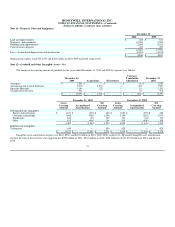
Note 9—Inventories
December 31,
2010 2009
Raw materials $ 1,158 $ 988
Work in process 810 796
Finished products 2,144 1,823
4,112 3,607
Reduction to LIFO cost basis (154) (161)
$ 3,958 $ 3,446
Inventories valued at LIFO amounted to $248 and $211 million at December 31, 2010 and 2009, respectively. Had such LIFO inventories been valued
at current costs, their carrying values would have been approximately $154 and $161 million higher at December 31, 2010 and 2009, respectively.
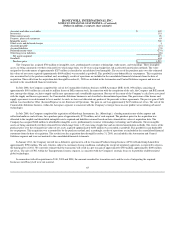
During the year ended December 31, 2009, the quantity of inventory valued using the last-in, first-out (LIFO) method in our Specialty Materials
segment declined. This reduction resulted in a liquidation of LIFO inventory quantities carried at lower costs prevailing in prior years as compared with the
cost of 2009 purchases, the effect of which decreased cost of products sold by $12 million during the year ended December 31, 2009.
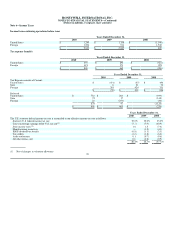
Note 10—Investments and Long-Term Receivables
December 31,
2010 2009
Investments $ 413 $ 262
Long-term trade and other receivables 83 175
Long-term financing receivables 120 142
$ 616 $ 579
Long-Term Trade and Other Receivables include $19 and $27 million of unbilled balances under long-term contracts as of December 31, 2010 and
2009, respectively. These amounts are billed in accordance with the terms of the customer contracts to which they relate.
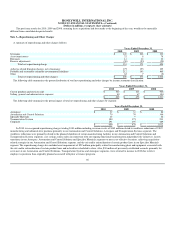
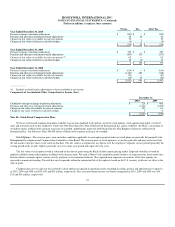
The following table summarizes long term trade, financing and other receivables by segment, including current portions and allowances for credit
losses.
December 31,
2010
Automation and Control Solutions 160
Specialty Materials 11
Transportation Systems 8
Corporate 29
$ 208
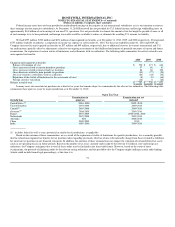
Allowance for credit losses for the above detailed long-term trade, financing and other receivables totaled $7 million and $7 million as of December 31,
2010 and 2009, respectively. The receivables are evaluated for impairment on an individual basis, including consideration of credit quality. The above
detailed financing receivables are predominately with commercial and governmental counterparties of investment grade credit quality.
74