Honeywell 2010 Annual Report Download - page 56
Download and view the complete annual report
Please find page 56 of the 2010 Honeywell annual report below. You can navigate through the pages in the report by either clicking on the pages listed below, or by using the keyword search tool below to find specific information within the annual report.-
 1
1 -
2
-
3
-
4
-
5
-
6
-
7
-
8
-
9
-
10
-
11
-
12
-
13
-
14
-
15
-
16
-
17
-
18
-
19
-
20
-
21
-
22
-
23
-
24
-
25
-
26
-
27
-
28
-
29
-
30
-
31
-
32
-
33
-
34
-
35
-
36
-
37
-
38
-
39
-
40
-
41
-
42
-
43
-
44
-
45
-
 46
46 -
 47
47 -
 48
48 -
 49
49 -
 50
50 -
 51
51 -
 52
52 -
 53
53 -
 54
54 -
 55
55 -
 56
56 -
 57
57 -
 58
58 -
 59
59 -
 60
60 -
 61
61 -
 62
62 -
 63
63 -
 64
64 -
 65
65 -
 66
66 -
67
-
68
-
69
-
70
-
71
-
72
-
73
-
74
-
75
-
76
-
77
-
78
-
79
-
80
-
81
-
82
-
83
-
84
-
85
-
86
-
87
-
88
-
89
-
90
-
91
-
92
-
93
-
94
-
95
-
96
-
97
-
98
-
99
-
100
-
101
-
102
-
103
-
104
-
105
-
106
-
107
-
108
-
109
-
110
-
111
-
112
-
113
-
114
-
115
-
116
-
117
-
118
-
119
-
120
-
121
-
122
-
123
-
124
-
125
-
126
-
127
-
128
-
129
-
130
-
131
-
132
-
133
-
134
-
135
-
136
-
137
-
138
-
139
-
140
-
141
-
142
-
143
-
144
-
145
-
146
-
147
-
148
-
149
-
150
-
151
-
152
-
153
-
154
-
155
-
156
-
157
-
158
-
159
-
160
-
161
-
162
-
163
-
164
-
165
-
166
-
167
-
168
-
169
-
170
-
171
-
172
-
173
-
174
-
175
-
176
-
177
-
178
-
179
-
180
-
181
-
182
-
183
 |
 |

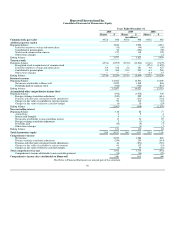
ITEM 8. Financial Statements and Supplementary Data
Honeywell International Inc.
Consolidated Statement of Operations
Years Ended December 31
2010 2009 2008
(Dollars in millions,
except per share amounts)
Product sales $ 26,262 $ 23,914 $ 29,212
Service sales 7,108 6,994 7,344
Net sales 33,370 30,908 36,556
Costs, expenses and other
Cost of products sold 20,701 19,317 25,610
Cost of services sold 4,818 4,695 5,508
25,519 24,012 31,118
Selling, general and administrative expenses 4,717 4,443 5,130
Other (income) expense (95) (55) (748)
Interest and other financial charges 386 459 456
30,527 28,859 35,956
Income before taxes 2,843 2,049 600
Tax expense (benefit) 808 465 (226)
Net income 2,035 1,584 826
Less: Net income attributable to the noncontrolling interest 13 36 20
Net income attributable to Honeywell $ 2,022 1,548 806
Earnings per share of common stock-basic $ 2.61 $ 2.06 $ 1.09
Earnings per share of common stock-assuming dilution $ 2.59 $ 2.05 $ 1.08
Cash dividends per share of common stock $ 1.21 $ 1.21 $ 1.10
The Notes to Financial Statements are an integral part of this statement.
53