Honeywell 2010 Annual Report Download - page 33
Download and view the complete annual report
Please find page 33 of the 2010 Honeywell annual report below. You can navigate through the pages in the report by either clicking on the pages listed below, or by using the keyword search tool below to find specific information within the annual report.-
 1
1 -
2
-
3
-
4
-
5
-
6
-
7
-
8
-
9
-
10
-
11
-
12
-
13
-
14
-
15
-
16
-
17
-
18
-
19
-
20
-
21
-
22
-
 23
23 -
 24
24 -
 25
25 -
 26
26 -
 27
27 -
 28
28 -
 29
29 -
 30
30 -
 31
31 -
 32
32 -
 33
33 -
 34
34 -
 35
35 -
 36
36 -
 37
37 -
 38
38 -
 39
39 -
 40
40 -
 41
41 -
 42
42 -
 43
43 -
44
-
45
-
46
-
47
-
48
-
49
-
50
-
51
-
52
-
53
-
54
-
55
-
56
-
57
-
58
-
59
-
60
-
61
-
62
-
63
-
64
-
65
-
66
-
67
-
68
-
69
-
70
-
71
-
72
-
73
-
74
-
75
-
76
-
77
-
78
-
79
-
80
-
81
-
82
-
83
-
84
-
85
-
86
-
87
-
88
-
89
-
90
-
91
-
92
-
93
-
94
-
95
-
96
-
97
-
98
-
99
-
100
-
101
-
102
-
103
-
104
-
105
-
106
-
107
-
108
-
109
-
110
-
111
-
112
-
113
-
114
-
115
-
116
-
117
-
118
-
119
-
120
-
121
-
122
-
123
-
124
-
125
-
126
-
127
-
128
-
129
-
130
-
131
-
132
-
133
-
134
-
135
-
136
-
137
-
138
-
139
-
140
-
141
-
142
-
143
-
144
-
145
-
146
-
147
-
148
-
149
-
150
-
151
-
152
-
153
-
154
-
155
-
156
-
157
-
158
-
159
-
160
-
161
-
162
-
163
-
164
-
165
-
166
-
167
-
168
-
169
-
170
-
171
-
172
-
173
-
174
-
175
-
176
-
177
-
178
-
179
-
180
-
181
-
182
-
183
 |
 |

• Global demand for commercial air travel as reflected in global flying hours and utilization rates for corporate and general aviation aircraft, as well as
the demand for spare parts and maintenance and repair services for aircraft currently in use;
• Level and mix of U.S. Government appropriations for defense and space programs and military activity; and
• Availability and price volatility of raw materials such as titanium and other metals.
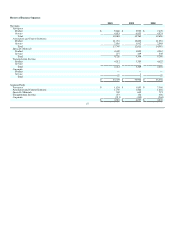
Aerospace
2010 2009 Change 2008 Change
Net sales $ 10,683 $ 10,763 (1)% $ 12,650 (15)%
Cost of products and services sold 8,099 8,099 9,426
Selling, general and administrative expenses 553 570 721
Other 196 201 203
Segment profit $ 1,835 $ 1,893 (3)% $ 2,300 (18)%
Factors Contributing to Year-Over-Year Change
2010 vs. 2009 2009 vs. 2008
Sales
Segment
Profit Sales
Segment
Profit
Organic growth/ Operational segment profit 0% 0% (13)% (18)%
Acquisitions and divestitures, net 0% 0% (2)% (2)%
Other (1)% (3)% — 2%
Total % Change (1)% (3)% (15)% (18)%
Aerospace sales by major customer end-markets were as follows:
% of Aerospace
Sales
% Change in
Sales
Customer End-Markets 2010 2009 2008
2010
Versus
2009
2009
Versus
2008
Commercial:
Air transport and regional
Original equipment 13% 13% 14% (2)% (21)%
Aftermarket 23% 22% 23% 1% (16)%
Business and general aviation
Original equipment 5% 7% 11% (27)% (51)%
Aftermarket 9% 8% 10% 8% (27)%
Defense and Space 50% 50% 42% 1% 0%
Total 100% 100% 100% (1)% (15)%
2010 compared with 2009
Aerospace sales decreased by 1 percent in 2010 compared with 2009 primarily due to a 1 percent reduction of revenue related to amounts recognized
for payments to business and general aviation original equipment manufacturers (OEM Payments) to partially offset their pre-production costs associated with
new aircraft platforms.
Details regarding the changes in sales by customer end-markets are as follows:
• Air transport and regional original equipment (OE) sales decreased by 2 percent in 2010 primarily due to lower sales to our air transport OE
customers.
30