Honeywell 2010 Annual Report Download - page 73
Download and view the complete annual report
Please find page 73 of the 2010 Honeywell annual report below. You can navigate through the pages in the report by either clicking on the pages listed below, or by using the keyword search tool below to find specific information within the annual report.-
 1
1 -
2
-
3
-
4
-
5
-
6
-
7
-
8
-
9
-
10
-
11
-
12
-
13
-
14
-
15
-
16
-
17
-
18
-
19
-
20
-
21
-
22
-
23
-
24
-
25
-
26
-
27
-
28
-
29
-
30
-
31
-
32
-
33
-
34
-
35
-
36
-
37
-
38
-
39
-
40
-
41
-
42
-
43
-
44
-
45
-
46
-
47
-
48
-
49
-
50
-
51
-
52
-
53
-
54
-
55
-
56
-
57
-
58
-
59
-
60
-
61
-
62
-
 63
63 -
 64
64 -
 65
65 -
 66
66 -
 67
67 -
 68
68 -
 69
69 -
 70
70 -
 71
71 -
 72
72 -
 73
73 -
 74
74 -
 75
75 -
 76
76 -
 77
77 -
 78
78 -
 79
79 -
 80
80 -
 81
81 -
 82
82 -
 83
83 -
84
-
85
-
86
-
87
-
88
-
89
-
90
-
91
-
92
-
93
-
94
-
95
-
96
-
97
-
98
-
99
-
100
-
101
-
102
-
103
-
104
-
105
-
106
-
107
-
108
-
109
-
110
-
111
-
112
-
113
-
114
-
115
-
116
-
117
-
118
-
119
-
120
-
121
-
122
-
123
-
124
-
125
-
126
-
127
-
128
-
129
-
130
-
131
-
132
-
133
-
134
-
135
-
136
-
137
-
138
-
139
-
140
-
141
-
142
-
143
-
144
-
145
-
146
-
147
-
148
-
149
-
150
-
151
-
152
-
153
-
154
-
155
-
156
-
157
-
158
-
159
-
160
-
161
-
162
-
163
-
164
-
165
-
166
-
167
-
168
-
169
-
170
-
171
-
172
-
173
-
174
-
175
-
176
-
177
-
178
-
179
-
180
-
181
-
182
-
183
 |
 |

HONEYWELL INTERNATIONAL INC.
NOTES TO FINANCIAL STATEMENTS—(Continued)
(Dollars in millions, except per share amounts)
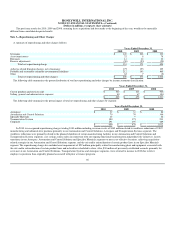
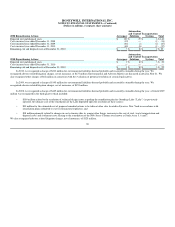
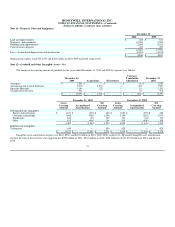
Note 6—Income Taxes
Income from continuing operations before taxes
Years Ended December 31,
2010 2009 2008
United States $ 1,249 $ 1,138 $ (1,140)
Foreign 1,594 911 1,740
$ 2,843 $ 2,049 $ 600
Tax expense (benefit)
Years Ended December 31,
2010 2009 2008
United States $ 393 $ 294 $ (521)
Foreign 415 171 295
$ 808 $ 465 $ (226)
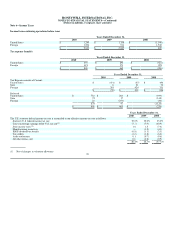
Years Ended December 31,
2010 2009 2008
Tax Expense consists of Current:
United States $ (471) $ (27) $ 493
State 8 21 70
Foreign 393 424 331
$ (70) $ 418 $ 894
Deferred:
United States $ 784 $ 283 $ (939)
State 72 17 (145)
Foreign 22 (253) (36)
878 47 (1,120)
$ 808 $ 465 $ (226)
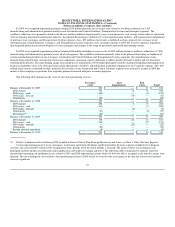
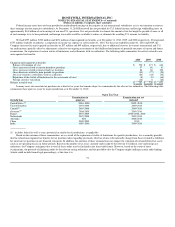
Years Ended December 31,
2010 2009 2008
The U.S. statutory federal income tax rate is reconciled to our effective income tax rate as follows:
Statutory U.S. federal income tax rate 35.0% 35.0% 35.0%
Taxes on foreign earnings below U.S. tax rate(1) (7.1) (7.9) (40.9)
State income taxes(1) 1.6 1.5 (7.3)
Manufacturing incentives — (1.5) (4.1)
ESOP dividend tax benefit (0.8) (1.1) (3.3)
Tax credits (1.2) (1.8) (6.6)
Audit settlements 0.1 (0.7) (9.6)
All other items—net 0.8 (0.8) (0.9)
28.4% 22.7% (37.7)%
(1) Net of changes in valuation allowance
70