Honeywell 2010 Annual Report Download - page 27
Download and view the complete annual report
Please find page 27 of the 2010 Honeywell annual report below. You can navigate through the pages in the report by either clicking on the pages listed below, or by using the keyword search tool below to find specific information within the annual report.-
 1
1 -
2
-
3
-
4
-
5
-
6
-
7
-
8
-
9
-
10
-
11
-
12
-
13
-
14
-
15
-
16
-
 17
17 -
 18
18 -
 19
19 -
 20
20 -
 21
21 -
 22
22 -
 23
23 -
 24
24 -
 25
25 -
 26
26 -
 27
27 -
 28
28 -
 29
29 -
 30
30 -
 31
31 -
 32
32 -
 33
33 -
 34
34 -
 35
35 -
 36
36 -
 37
37 -
38
-
39
-
40
-
41
-
42
-
43
-
44
-
45
-
46
-
47
-
48
-
49
-
50
-
51
-
52
-
53
-
54
-
55
-
56
-
57
-
58
-
59
-
60
-
61
-
62
-
63
-
64
-
65
-
66
-
67
-
68
-
69
-
70
-
71
-
72
-
73
-
74
-
75
-
76
-
77
-
78
-
79
-
80
-
81
-
82
-
83
-
84
-
85
-
86
-
87
-
88
-
89
-
90
-
91
-
92
-
93
-
94
-
95
-
96
-
97
-
98
-
99
-
100
-
101
-
102
-
103
-
104
-
105
-
106
-
107
-
108
-
109
-
110
-
111
-
112
-
113
-
114
-
115
-
116
-
117
-
118
-
119
-
120
-
121
-
122
-
123
-
124
-
125
-
126
-
127
-
128
-
129
-
130
-
131
-
132
-
133
-
134
-
135
-
136
-
137
-
138
-
139
-
140
-
141
-
142
-
143
-
144
-
145
-
146
-
147
-
148
-
149
-
150
-
151
-
152
-
153
-
154
-
155
-
156
-
157
-
158
-
159
-
160
-
161
-
162
-
163
-
164
-
165
-
166
-
167
-
168
-
169
-
170
-
171
-
172
-
173
-
174
-
175
-
176
-
177
-
178
-
179
-
180
-
181
-
182
-
183
 |
 |

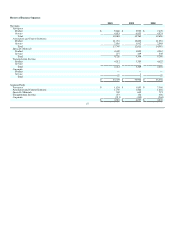
Gross margin percentage increased by 7.4 percentage points in 2009 compared with 2008, primarily due to lower pension expense, increases of 2.9 and
0.6 percent, respectively, in our Specialty Materials and Automation & Controls Solutions segments, as a result of the cost savings initiatives discussed above,
and lower repositioning charges, partially offset by lower margins in our Transportation Systems and Aerospace Solutions segments of 3.2 and 0.7 percent,
respectively, due to lower sales partially offset by the impact of cost savings initiatives.
Selling, General and Administrative Expenses
2010 2009 2008
Selling, general and administrative expense $ 4,717 $ 4,443 $ 5,130
Percent of sales 14.1% 14.4% 14.0%
Selling, general and administrative expenses (SG&A) decreased as a percentage of sales by 0.3 percent in 2010 compared to the 2009 driven by the
impact of higher sales volume, discussed above, and lower pension expense, partially offset by an estimated $500 million increase in labor costs (reflecting
the absence of prior period labor cost actions).
SG&A as a percentage of sales increased by 0.4 of a percentage point in 2009 compared with 2008. The increase as a percentage of sales was driven by
lower sales volumes, substantially offset by the positive impact of i) lower pension expense, (ii) indirect cost savings initiatives across each of our Business
Segments, iii) reduced labor costs (reflecting reduced census, work schedule reductions, benefits from prior repositioning actions and lower incentive
compensation) and iv) lower repositioning charges.
Other (Income) Expense
2010 2009 2008
Equity (income)/loss of affiliated companies $ (29) $ (26) $ (63)
Gain on sale of non-strategic businesses and assets — (87) (635)
Interest income (40) (33) (102)
Foreign exchange 13 45 52
Other, net (39) 46 —
$ (95) $ (55) $ (748)
Other income increased by $40 million in 2010 compared to 2009 due primarily to i) a $62 million pre-tax gain related to the consolidation of a joint
venture within our Specialty Materials segment in the third quarter of 2010 (see Note 4 of Notes to Financial statements) for further details, ii) the absence of
an other-than-temporary impairment charge of $62 million in the second quarter of 2009, partially offset by the absence of a $50 million deconsolidation gain
related to a subsidiary within our Automation and Control Solutions segment in 2009 and $22 million of acquisition related costs in 2010.
Other income decreased by $693 million in 2009 compared to 2008 primarily due to i) a lower gain on sale of non-strategic businesses and assets due to
the gain on the sale of our Consumables Solutions business in 2008 partially offset by a gain related to the deconsolidation of a subsidiary within our
Automation and Control Solutions segment in 2009 (See Note 4 to the financial statements) and ii) lower interest income primarily due to lower interest rates
on cash balances.
Interest and Other Financial Charges
2010 2009 2008
Interest and other financial charges $ 386 $ 459 $ 456
% change compared with prior period (16)% 1%
Interest and other financial charges decreased by 16 percent in 2010 compared with 2009 primarily due to lower debt balances and lower borrowing
costs.
24