Honeywell 2010 Annual Report Download - page 78
Download and view the complete annual report
Please find page 78 of the 2010 Honeywell annual report below. You can navigate through the pages in the report by either clicking on the pages listed below, or by using the keyword search tool below to find specific information within the annual report.-
 1
1 -
2
-
3
-
4
-
5
-
6
-
7
-
8
-
9
-
10
-
11
-
12
-
13
-
14
-
15
-
16
-
17
-
18
-
19
-
20
-
21
-
22
-
23
-
24
-
25
-
26
-
27
-
28
-
29
-
30
-
31
-
32
-
33
-
34
-
35
-
36
-
37
-
38
-
39
-
40
-
41
-
42
-
43
-
44
-
45
-
46
-
47
-
48
-
49
-
50
-
51
-
52
-
53
-
54
-
55
-
56
-
57
-
58
-
59
-
60
-
61
-
62
-
63
-
64
-
65
-
66
-
67
-
 68
68 -
 69
69 -
 70
70 -
 71
71 -
 72
72 -
 73
73 -
 74
74 -
 75
75 -
 76
76 -
 77
77 -
 78
78 -
 79
79 -
 80
80 -
 81
81 -
 82
82 -
 83
83 -
 84
84 -
 85
85 -
 86
86 -
 87
87 -
 88
88 -
89
-
90
-
91
-
92
-
93
-
94
-
95
-
96
-
97
-
98
-
99
-
100
-
101
-
102
-
103
-
104
-
105
-
106
-
107
-
108
-
109
-
110
-
111
-
112
-
113
-
114
-
115
-
116
-
117
-
118
-
119
-
120
-
121
-
122
-
123
-
124
-
125
-
126
-
127
-
128
-
129
-
130
-
131
-
132
-
133
-
134
-
135
-
136
-
137
-
138
-
139
-
140
-
141
-
142
-
143
-
144
-
145
-
146
-
147
-
148
-
149
-
150
-
151
-
152
-
153
-
154
-
155
-
156
-
157
-
158
-
159
-
160
-
161
-
162
-
163
-
164
-
165
-
166
-
167
-
168
-
169
-
170
-
171
-
172
-
173
-
174
-
175
-
176
-
177
-
178
-
179
-
180
-
181
-
182
-
183
 |
 |

HONEYWELL INTERNATIONAL INC.
NOTES TO FINANCIAL STATEMENTS—(Continued)
(Dollars in millions, except per share amounts)
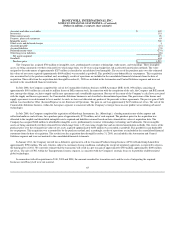
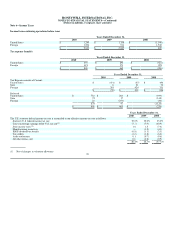
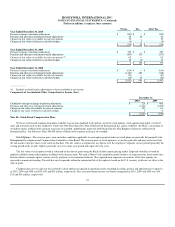
Note 11—Property, Plant and Equipment
December 31,
2010 2009
Land and improvements $ 525 $ 513
Machinery and equipment 10,204 9,982
Buildings and improvements 2,669 2,621
Construction in progress 403 405
13,801 13,521
Less—Accumulated depreciation and amortization (8,961) (8,674)
$ 4,840 $ 4,847
Depreciation expense was $724, $707 and $702 million in 2010, 2009 and 2008, respectively.
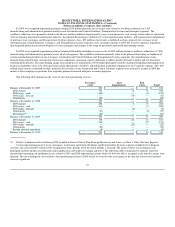
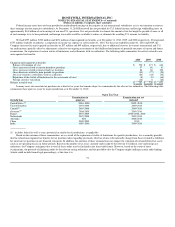
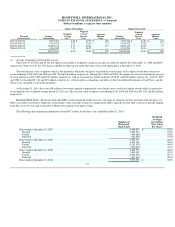
Note 12—Goodwill and Other Intangible Assets - Net
The change in the carrying amount of goodwill for the years ended December 31, 2010 and 2009 by segment is as follows:
December 31,
2009 Acquisitions Divestitures
Currency
Translation
Adjustment December 31,
2010
Aerospace $ 1,891 $ — $ — $ (8) $ 1,883
Automation and Control Solutions 6,918 1,074 — (85) 7,907
Specialty Materials 1,164 132 — (5) 1,291
Transportation Systems 521 — — (5) 516
$ 10,494 $ 1,206 $ — $ (103) $ 11,597
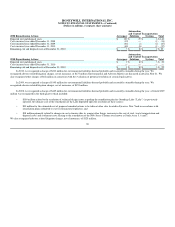
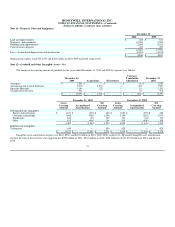
December 31, 2010 December 31, 2009
Gross
Carrying
Amount Accumulated
Amortization
Net
Carrying
Amount
Gross
Carrying
Amount Accumulated
Amortization
Net
Carrying
Amount
Determinable life intangibles:
Patents and technology $ 1,101 $ (676) $ 425 $ 1,053 $ (595) $ 458
Customer relationships 1,688 (399) 1,289 1,359 (282) 1,077
Trademarks 186 (84) 102 164 (62) 102
Other 512 (404) 108 514 (406) 108
3,487 (1,563) 1,924 3,090 (1,345) 1,745
Indefinite life intangibles:
Trademarks 650 — 650 429 — 429
$ 4,137 $ (1,563) $ 2,574 $ 3,519 $ (1,345) $ 2,174
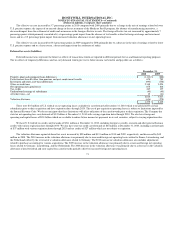
Intangible assets amortization expense was $263, $250, and $201 million in 2010, 2009, 2008, respectively. Estimated intangible asset amortization
expense for each of the next five years approximates $259 million in 2011, $253 million in 2012, $228 million in 2013, $196 million in 2014, and $161 in
2015.
75