Honeywell 2010 Annual Report Download - page 34
Download and view the complete annual report
Please find page 34 of the 2010 Honeywell annual report below. You can navigate through the pages in the report by either clicking on the pages listed below, or by using the keyword search tool below to find specific information within the annual report.-
 1
1 -
2
-
3
-
4
-
5
-
6
-
7
-
8
-
9
-
10
-
11
-
12
-
13
-
14
-
15
-
16
-
17
-
18
-
19
-
20
-
21
-
22
-
23
-
 24
24 -
 25
25 -
 26
26 -
 27
27 -
 28
28 -
 29
29 -
 30
30 -
 31
31 -
 32
32 -
 33
33 -
 34
34 -
 35
35 -
 36
36 -
 37
37 -
 38
38 -
 39
39 -
 40
40 -
 41
41 -
 42
42 -
 43
43 -
 44
44 -
45
-
46
-
47
-
48
-
49
-
50
-
51
-
52
-
53
-
54
-
55
-
56
-
57
-
58
-
59
-
60
-
61
-
62
-
63
-
64
-
65
-
66
-
67
-
68
-
69
-
70
-
71
-
72
-
73
-
74
-
75
-
76
-
77
-
78
-
79
-
80
-
81
-
82
-
83
-
84
-
85
-
86
-
87
-
88
-
89
-
90
-
91
-
92
-
93
-
94
-
95
-
96
-
97
-
98
-
99
-
100
-
101
-
102
-
103
-
104
-
105
-
106
-
107
-
108
-
109
-
110
-
111
-
112
-
113
-
114
-
115
-
116
-
117
-
118
-
119
-
120
-
121
-
122
-
123
-
124
-
125
-
126
-
127
-
128
-
129
-
130
-
131
-
132
-
133
-
134
-
135
-
136
-
137
-
138
-
139
-
140
-
141
-
142
-
143
-
144
-
145
-
146
-
147
-
148
-
149
-
150
-
151
-
152
-
153
-
154
-
155
-
156
-
157
-
158
-
159
-
160
-
161
-
162
-
163
-
164
-
165
-
166
-
167
-
168
-
169
-
170
-
171
-
172
-
173
-
174
-
175
-
176
-
177
-
178
-
179
-
180
-
181
-
182
-
183
 |
 |

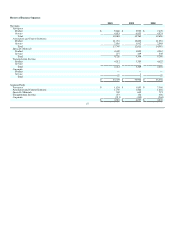
• Air transport and regional aftermarket sales increased by 1 percent for 2010 primarily due to increased sales of spare parts driven by the impact of
increased flying hours of approximately 6 percent in 2010.
• Business and general aviation OE sales decreased by 27 percent in 2010 due to decreases in new business jet deliveries reflecting rescheduling and
cancellations of deliveries by OE customers in the first six months and the impact of the OEM Payments discussed above.
• Business and general aviation aftermarket sales increased by 8 percent in 2010 primarily due to increased sales of spare parts due to higher engine
utilization, partially offset by lower revenue associated with licensing and maintenance service agreements.
• Defense and space sales increased by 1 percent in 2010 primarily due to higher sales of logistics services partially offset by program wind-downs
and completions and lower sales related to commercial helicopters. Changes in defense and space budgets and program delays are anticipated to
impact the amount and timing of sales in this end-market in 2011.
Aerospace segment profit decreased by 3 percent in 2010 compared with 2009 primarily due to a negative 3 percent impact from the OEM payments,
discussed above. Operational segment profit was flat in 2010 with the approximate positive 4 percent impact from price and productivity, net of inflation
(including the absence of prior period labor cost actions offset by the benefits from prior repositioning actions) offset by an approximate negative 4 percent
impact from lower sales volume. Cost of goods sold totaled $8.1 billion in 2010, unchanged from 2009.
2009 compared with 2008
Aerospace sales decreased by 15 percent in 2009. Details regarding the decrease in sales by customer end-markets are as follows:
• Air transport and regional original equipment (OE) sales decreased by 21 percent in 2009. The decrease is driven by lower sales to our OE
customers, consistent with production rates and platform mix, and the impact of divesting our Consumables Solutions business, partially offset by a
12 percent increase in the fourth quarter of 2009 mainly due to the absence of a strike at a major OEM in the fourth quarter of 2008.
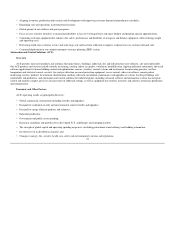
• Air transport and regional aftermarket sales decreased by 16 percent in 2009 primarily due to decreased sales of spare parts and lower maintenance
activity driven by the impact of higher parked aircraft part utilization, customer inventory reductions initiatives and decreased flying hours of
approximately 2 percent, including a 1 percent increase in the fourth quarter.
• Business and general aviation OE sales decreased by 51 percent in 2009 due to the decreases in new business jet deliveries reflecting rescheduling
and cancellations of deliveries by OE customers.
• Business and general aviation aftermarket sales decreased by 27 percent in 2009. The decrease was primarily due to decreased sales of spare parts
and lower revenue associated with maintenance service agreements, consistent with the decrease in business jet utilization. We started to see an
increase in business jet utilization rates in the fourth quarter of 2009.
• Defense and space sales were essentially unchanged in 2009, primarily due to higher sales of logistics services and original equipment for military
platforms in the first nine months of 2009 offset by program completions.
Aerospace segment profit decreased by 18 percent in 2009 compared to 2008 due primarily to lower sales as a result of the factors discussed above and
inflation, partially offset by volume related material cost reductions and reduced labor costs (reflecting reduced census, work schedule reductions, benefits
from prior repositioning actions and lower incentive compensation), the positive impact of cost savings initiatives and increased prices.
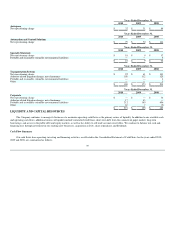
2011 Areas of Focus
Aerospace's primary areas of focus for 2011 include:
31