Honeywell 2010 Annual Report Download - page 63
Download and view the complete annual report
Please find page 63 of the 2010 Honeywell annual report below. You can navigate through the pages in the report by either clicking on the pages listed below, or by using the keyword search tool below to find specific information within the annual report.-
 1
1 -
2
-
3
-
4
-
5
-
6
-
7
-
8
-
9
-
10
-
11
-
12
-
13
-
14
-
15
-
16
-
17
-
18
-
19
-
20
-
21
-
22
-
23
-
24
-
25
-
26
-
27
-
28
-
29
-
30
-
31
-
32
-
33
-
34
-
35
-
36
-
37
-
38
-
39
-
40
-
41
-
42
-
43
-
44
-
45
-
46
-
47
-
48
-
49
-
50
-
51
-
52
-
 53
53 -
 54
54 -
 55
55 -
 56
56 -
 57
57 -
 58
58 -
 59
59 -
 60
60 -
 61
61 -
 62
62 -
 63
63 -
 64
64 -
 65
65 -
 66
66 -
 67
67 -
 68
68 -
 69
69 -
 70
70 -
 71
71 -
 72
72 -
 73
73 -
74
-
75
-
76
-
77
-
78
-
79
-
80
-
81
-
82
-
83
-
84
-
85
-
86
-
87
-
88
-
89
-
90
-
91
-
92
-
93
-
94
-
95
-
96
-
97
-
98
-
99
-
100
-
101
-
102
-
103
-
104
-
105
-
106
-
107
-
108
-
109
-
110
-
111
-
112
-
113
-
114
-
115
-
116
-
117
-
118
-
119
-
120
-
121
-
122
-
123
-
124
-
125
-
126
-
127
-
128
-
129
-
130
-
131
-
132
-
133
-
134
-
135
-
136
-
137
-
138
-
139
-
140
-
141
-
142
-
143
-
144
-
145
-
146
-
147
-
148
-
149
-
150
-
151
-
152
-
153
-
154
-
155
-
156
-
157
-
158
-
159
-
160
-
161
-
162
-
163
-
164
-
165
-
166
-
167
-
168
-
169
-
170
-
171
-
172
-
173
-
174
-
175
-
176
-
177
-
178
-
179
-
180
-
181
-
182
-
183
 |
 |

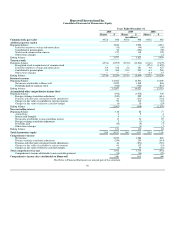
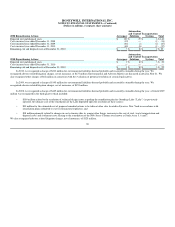
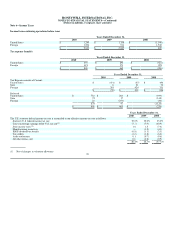
HONEYWELL INTERNATIONAL INC.
NOTES TO FINANCIAL STATEMENTS—(Continued)
(Dollars in millions, except per share amounts)
Year Ended December 31, 2008
Previously
Reported Revised Effect of
Change
Cost of products sold 23,043 25,610 2,567
Cost of services sold 4,951 5,508 557
Selling, general and administrative expenses 5,033 5,130 97
Income before taxes 3,821 600 (3,221)
Tax expense (benefit) 1,009 (226) (1,235)
Net income 2,812 826 (1,986)
Net income attributable to Honeywell 2,792 806 (1,986)
Earnings per share of common stock-basic 3.79 1.09 (2.70)
Earnings per share of common stock-assuming dilution 3.76 1.08 (2.68)
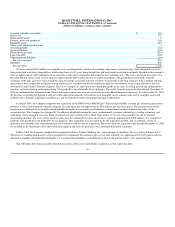
Consolidated Balance Sheet
December 31, 2009
Previously
Reported Revised Effect of
Change
Deferred income taxes 2,017 2,006 (11)
Total assets 36,004 35,993 (11)
Other liabilities 6,481 6,453 (28)
Accumulated other comprehensive income (loss) (4,429) (948) 3,481
Retained earnings 17,487 14,023 (3,464)
Total Honeywell shareowners' equity 8,844 8,861 17
Total shareowners' equity 8,954 8,971 17
Total liabilities and shareowners' equity 36,004 35,993 (11)
Consolidated Statement of Cash Flows
Year Ended December 31, 2009
Previously
Reported Revised Effect of
Change
Cash flows from operating activities:
Net income attributable to Honeywell 2,153 1,548 (605)
Pension and other postretirement expense 93 1,022 929
Deferred income taxes 371 47 (324)
Year Ended December 31, 2008
Previously
Reported Revised Effect of
Change
Cash flows from operating activities:
Net income attributable to Honeywell 2,792 806 (1,986)
Pension and other postretirement expense 113 3,334 3,221
Deferred income taxes 115 (1,120) (1,235)
60