Honeywell 2010 Annual Report Download - page 70
Download and view the complete annual report
Please find page 70 of the 2010 Honeywell annual report below. You can navigate through the pages in the report by either clicking on the pages listed below, or by using the keyword search tool below to find specific information within the annual report.-
 1
1 -
2
-
3
-
4
-
5
-
6
-
7
-
8
-
9
-
10
-
11
-
12
-
13
-
14
-
15
-
16
-
17
-
18
-
19
-
20
-
21
-
22
-
23
-
24
-
25
-
26
-
27
-
28
-
29
-
30
-
31
-
32
-
33
-
34
-
35
-
36
-
37
-
38
-
39
-
40
-
41
-
42
-
43
-
44
-
45
-
46
-
47
-
48
-
49
-
50
-
51
-
52
-
53
-
54
-
55
-
56
-
57
-
58
-
59
-
 60
60 -
 61
61 -
 62
62 -
 63
63 -
 64
64 -
 65
65 -
 66
66 -
 67
67 -
 68
68 -
 69
69 -
 70
70 -
 71
71 -
 72
72 -
 73
73 -
 74
74 -
 75
75 -
 76
76 -
 77
77 -
 78
78 -
 79
79 -
 80
80 -
81
-
82
-
83
-
84
-
85
-
86
-
87
-
88
-
89
-
90
-
91
-
92
-
93
-
94
-
95
-
96
-
97
-
98
-
99
-
100
-
101
-
102
-
103
-
104
-
105
-
106
-
107
-
108
-
109
-
110
-
111
-
112
-
113
-
114
-
115
-
116
-
117
-
118
-
119
-
120
-
121
-
122
-
123
-
124
-
125
-
126
-
127
-
128
-
129
-
130
-
131
-
132
-
133
-
134
-
135
-
136
-
137
-
138
-
139
-
140
-
141
-
142
-
143
-
144
-
145
-
146
-
147
-
148
-
149
-
150
-
151
-
152
-
153
-
154
-
155
-
156
-
157
-
158
-
159
-
160
-
161
-
162
-
163
-
164
-
165
-
166
-
167
-
168
-
169
-
170
-
171
-
172
-
173
-
174
-
175
-
176
-
177
-
178
-
179
-
180
-
181
-
182
-
183
 |
 |

HONEYWELL INTERNATIONAL INC.
NOTES TO FINANCIAL STATEMENTS—(Continued)
(Dollars in millions, except per share amounts)
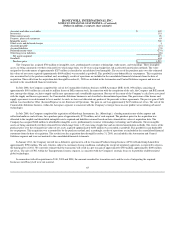
In 2009, we recognized repositioning charges totaling $224 million primarily for severance costs related to workforce reductions of 4,423
manufacturing and administrative positions mainly in our Automation and Control Solutions, Transportation Systems and Aerospace segments. The
workforce reductions were primarily related to the adverse market conditions experienced by many of our businesses, cost savings actions taken in connection
with our ongoing functional transformation initiative, the planned downsizing or shutdown of certain manufacturing facilities, and organizational realignments
of portions of our Aerospace and Transportation Systems segments. Also, $53 million of previously established accruals, primarily for severance at our
Automation and Control Solutions, Aerospace, and Transportation Systems segments, were returned to income in 2009 due to fewer employee separations
than originally planned associated with prior severance programs and changes in the scope of previously announced repositioning actions.
In 2008, we recognized repositioning charges totaling $444 million including severance costs of $333 million related to workforce reductions of 7,480
manufacturing and administrative positions across all of our segments. The workforce reductions primarily relate to the planned downsizing or shutdown of
certain manufacturing facilities in our Aerospace, Automation and Control Solutions and Transportation Systems segments, the rationalization of non-
manufacturing infrastructure, outsourcing of non-core components, managing capacity utilization to address product demand volatility and our functional
transformation initiative. The repositioning charge also included asset impairments of $78 million principally related to manufacturing plant and equipment in
facilities scheduled to close or be downsized and certain administrative facilities, and information technology equipment in our Corporate segment. Also, $20
million of previously established accruals, primarily for severance at our Automation and Control Solutions segment were returned to income in 2008 due
mainly to fewer employee separations than originally planned associated with prior severance programs.
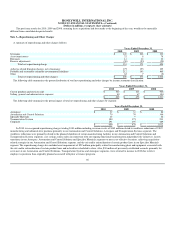
The following table summarizes the status of our total repositioning reserves:
Severance
Costs Asset
Impairments Exit
Costs Total
Balance at December 31, 2007 $ 201 $ — $ 11 $ 212
2008 charges 333 78 33 444
2008 usage - cash (149) — (8) (157)
2008 usage - noncash — (78) — (78)
Adjustments (20) — — (20)
Balance at December 31, 2008 365 — 36 401
2009 charges 206 8 10 224
2009 usage - cash (193) — (7) (200)
2009 usage - noncash — (8) — (8)
Adjustments (51) — (2) (53)
Divestitures(1) (24) — — (24)
Balance at December 31, 2009 303 — 37 340
2010 charges 145 22 14 181
2010 usage - cash (134) — (17) (151)
2010 usage - noncash — (22) — (22)
Adjustments (30) — — (30)
Foreign currency translation (8) — — (8)
Balance at December 31, 2010 $ 276 $ — $ 34 $ 310
(1) Relates to businesses divested during 2009 included in Gain on Sale of Non-Strategic Businesses and Assets see Note 4, Other (Income) Expense.
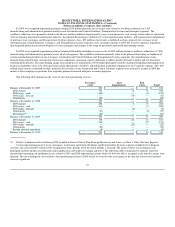
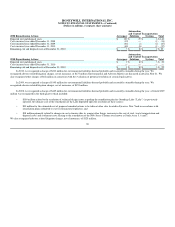
Certain repositioning projects in our Aerospace, Automation and Control Solutions and Transportation Systems segments included exit or disposal
activities, the costs related to which will be recognized in future periods when the actual liability is incurred. The nature of these exit or disposal costs
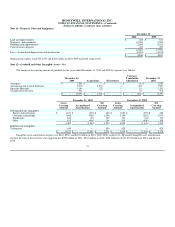
principally includes product recertification and requalification and employee training and travel. The following tables summarize by segment, expected,
incurred and remaining exit and disposal costs related to 2010 and 2008 repositioning actions which we were not able to recognize at the time the actions were
initiated. The exit and disposal costs related to the repositioning actions in 2009, which we were not able to recognize at the time the actions were initiated
were not significant.
67