Honeywell 2010 Annual Report Download - page 26
Download and view the complete annual report
Please find page 26 of the 2010 Honeywell annual report below. You can navigate through the pages in the report by either clicking on the pages listed below, or by using the keyword search tool below to find specific information within the annual report.-
 1
1 -
2
-
3
-
4
-
5
-
6
-
7
-
8
-
9
-
10
-
11
-
12
-
13
-
14
-
15
-
 16
16 -
 17
17 -
 18
18 -
 19
19 -
 20
20 -
 21
21 -
 22
22 -
 23
23 -
 24
24 -
 25
25 -
 26
26 -
 27
27 -
 28
28 -
 29
29 -
 30
30 -
 31
31 -
 32
32 -
 33
33 -
 34
34 -
 35
35 -
 36
36 -
37
-
38
-
39
-
40
-
41
-
42
-
43
-
44
-
45
-
46
-
47
-
48
-
49
-
50
-
51
-
52
-
53
-
54
-
55
-
56
-
57
-
58
-
59
-
60
-
61
-
62
-
63
-
64
-
65
-
66
-
67
-
68
-
69
-
70
-
71
-
72
-
73
-
74
-
75
-
76
-
77
-
78
-
79
-
80
-
81
-
82
-
83
-
84
-
85
-
86
-
87
-
88
-
89
-
90
-
91
-
92
-
93
-
94
-
95
-
96
-
97
-
98
-
99
-
100
-
101
-
102
-
103
-
104
-
105
-
106
-
107
-
108
-
109
-
110
-
111
-
112
-
113
-
114
-
115
-
116
-
117
-
118
-
119
-
120
-
121
-
122
-
123
-
124
-
125
-
126
-
127
-
128
-
129
-
130
-
131
-
132
-
133
-
134
-
135
-
136
-
137
-
138
-
139
-
140
-
141
-
142
-
143
-
144
-
145
-
146
-
147
-
148
-
149
-
150
-
151
-
152
-
153
-
154
-
155
-
156
-
157
-
158
-
159
-
160
-
161
-
162
-
163
-
164
-
165
-
166
-
167
-
168
-
169
-
170
-
171
-
172
-
173
-
174
-
175
-
176
-
177
-
178
-
179
-
180
-
181
-
182
-
183
 |
 |

Item 7. Management's Discussion and Analysis of Financial Condition and Results of Operations
(Dollars in millions, except per share amounts)
The following Management's Discussion and Analysis of Financial Condition and Results of Operations ("MD&A") is intended to help the reader
understand the results of operations and financial condition of Honeywell International Inc. ("Honeywell") for the three years ended December 31, 2010. All
references to Notes related to Notes to the Financial Statements in "Item 8-Financial Statements and Supplementary Data".
CONSOLIDATED RESULTS OF OPERATIONS
Net Sales
2010 2009 2008
Net sales $ 33,370 $ 30,908 $ 36,556
% change compared with prior period 8% (15)%
The change in net sales compared to the prior year period is attributable to the following:
2010
Versus
2009
2009
Versus
2008
Volume 5% (14)%
Price 2% 0%
Acquisitions/Divestitures 1% 1%
Foreign Exchange 0% (2)%
8% (15)%
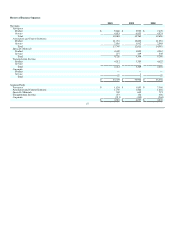
A discussion of net sales by segment can be found in the Review of Business Segments section of this MD&A.
Cost of Products and Services Sold
2010 2009 2008
Cost of products and services sold $ 25,519 $ 24,012 $ 31,118
% change compared with prior period 6% (23)%
Gross Margin percentage 23.5% 22.3% 14.9%
Cost of products and services sold increased by $1,507 million or 6 percent in 2010 compared with 2009 principally due to an estimated increase in
direct material costs and indirect costs of approximately $1,300 million and $300 million, respectively, driven substantially by an 8 percent increase in sales
as a result of the factors discussed above and in the Review of Business Segments section of this MD&A and an $150 million increase in Repositioning and
Other Charges (see Note 3 of Notes to Financial Statements), partially offset by a $300 million decrease in pension expense.
Gross margin percentage increased by 1.2 percentage points in 2010 compared with 2009 primarily due to lower pension expense (approximate 1
percentage point impact) and higher sales volume driven by our Automation and Control Solutions segment, Specialty Materials segment and Transportation
Systems segment (approximate 0.7 percentage point impact), partially offset by higher repositioning and other charges (approximate 0.4 percentage point
impact).
Cost of products and services sold decreased by $7,106 million or 23 percent in the 2009 compared with 2008. The decrease is primarily due to lower
pension expense, lower sales as a result of the factors discussed within the Review of Business Segments section of this MD&A, lower material costs, reduced
labor costs (reflecting reduced census, work scheduled reductions, benefits from prior repositioning actions and lower incentive compensation), the positive
impact of indirect cost savings initiatives across each of our Business Segments, and lower repositioning charges.
23