Honeywell 2010 Annual Report Download - page 74
Download and view the complete annual report
Please find page 74 of the 2010 Honeywell annual report below. You can navigate through the pages in the report by either clicking on the pages listed below, or by using the keyword search tool below to find specific information within the annual report.-
 1
1 -
2
-
3
-
4
-
5
-
6
-
7
-
8
-
9
-
10
-
11
-
12
-
13
-
14
-
15
-
16
-
17
-
18
-
19
-
20
-
21
-
22
-
23
-
24
-
25
-
26
-
27
-
28
-
29
-
30
-
31
-
32
-
33
-
34
-
35
-
36
-
37
-
38
-
39
-
40
-
41
-
42
-
43
-
44
-
45
-
46
-
47
-
48
-
49
-
50
-
51
-
52
-
53
-
54
-
55
-
56
-
57
-
58
-
59
-
60
-
61
-
62
-
63
-
 64
64 -
 65
65 -
 66
66 -
 67
67 -
 68
68 -
 69
69 -
 70
70 -
 71
71 -
 72
72 -
 73
73 -
 74
74 -
 75
75 -
 76
76 -
 77
77 -
 78
78 -
 79
79 -
 80
80 -
 81
81 -
 82
82 -
 83
83 -
 84
84 -
85
-
86
-
87
-
88
-
89
-
90
-
91
-
92
-
93
-
94
-
95
-
96
-
97
-
98
-
99
-
100
-
101
-
102
-
103
-
104
-
105
-
106
-
107
-
108
-
109
-
110
-
111
-
112
-
113
-
114
-
115
-
116
-
117
-
118
-
119
-
120
-
121
-
122
-
123
-
124
-
125
-
126
-
127
-
128
-
129
-
130
-
131
-
132
-
133
-
134
-
135
-
136
-
137
-
138
-
139
-
140
-
141
-
142
-
143
-
144
-
145
-
146
-
147
-
148
-
149
-
150
-
151
-
152
-
153
-
154
-
155
-
156
-
157
-
158
-
159
-
160
-
161
-
162
-
163
-
164
-
165
-
166
-
167
-
168
-
169
-
170
-
171
-
172
-
173
-
174
-
175
-
176
-
177
-
178
-
179
-
180
-
181
-
182
-
183
 |
 |

HONEYWELL INTERNATIONAL INC.
NOTES TO FINANCIAL STATEMENTS—(Continued)
(Dollars in millions, except per share amounts)
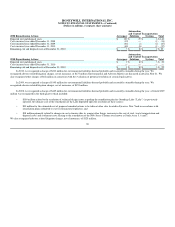
The effective tax rate increased by 5.7 percentage points in 2010 compared with 2009 primarily due to a change in the mix of earnings related to lower
U.S. pension expense, the impact of an enacted change in the tax treatment of the Medicare Part D program, the absence of manufacturing incentives, a
decreased impact from the settlement of audits and an increase in the foreign effective tax rate. The foreign effective tax rate increased by approximately 7
percentage points which primarily consisted of i) a 6 percentage point impact from the absence of tax benefits related to foreign exchange and investment
losses and ii) a 0.5 percentage point impact from increased valuation allowances on net operating losses.
The effective tax rate increased by 60.4 percentage points in 2009 compared to 2008 primarily due to a decrease in the mix of earnings related to lower
U.S. pension expense and to a lesser extent, a decreased impact from the settlement of audits.
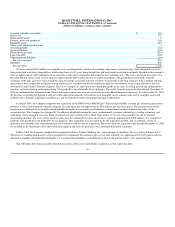
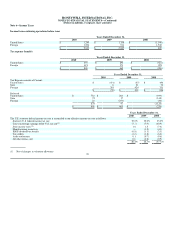
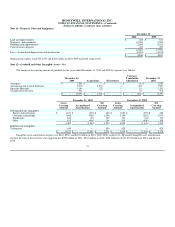
Deferred tax assets (liabilities)
Deferred income taxes represent the future tax effects of transactions which are reported in different periods for tax and financial reporting purposes.
The tax effects of temporary differences and tax carryforwards which give rise to future income tax benefits and payables are as follows:
December 31,
2010 2009
Property, plant and equipment basis differences $ (1,113) $ (888)
Postretirement benefits other than pensions and post employment benefits 674 785
Investment and other asset basis differences (993) (758)
Other accrued items 2,348 3,024
Net operating and capital losses 875 818
Tax credits 249 137
Undistributed earnings of subsidiaries (40) (40)
All other items—net 15 (61)
2,015 3,017
Valuation allowance (636) (578)
$ 1,379 $ 2,439
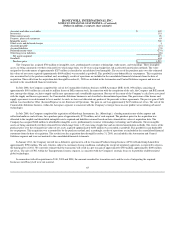
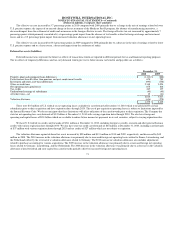
There were $35 million of U.S. federal tax net operating losses available for carryforward at December 31, 2010 which were generated by certain
subsidiaries prior to their acquisition and have expiration dates through 2029. The use of pre-acquisition operating losses is subject to limitations imposed by
the Internal Revenue Code. We do not anticipate that these limitations will affect utilization of the carryforwards prior to their expiration. The Company has
state tax net operating loss carryforwards of $3.2 billion at December 31, 2010 with varying expiration dates through 2030. We also have foreign net
operating and capital losses of $2.8 billion which are available to reduce future income tax payments in several countries, subject to varying expiration rules.
We have U.S. federal tax credit carryforwards of $311 million at December 31, 2010, including foreign tax credits, research and other general business
credits with various expiration dates through 2030. We also have state tax credit carryforwards of $64 million at December 31, 2010, including carryforwards
of $37 million with various expiration dates through 2025 and tax credits of $27 million which are not subject to expiration.
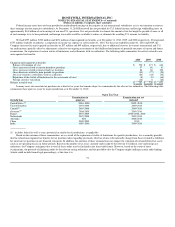
The valuation allowance against deferred tax assets increased by $58 million and $133 million in 2010 and 2009, respectively, and decreased by $45
million in 2008. The 2010 increase in the valuation allowance was primarily due to increased foreign net operating losses related to France, Luxembourg, and
the Netherlands offset by the reversal of a valuation allowance related to Germany. The 2010 increase in valuations allowance also includes adjustments
related to purchase accounting for various acquisitions. The 2009 increase in the valuation allowance was primarily due to a increased foreign net operating
losses related to Germany, Luxembourg, and the Netherlands. The 2008 decrease in the valuation allowance was primarily due to a decrease in the valuation
allowance related to federal and state capital loss carryforwards partially offset by increased foreign net operating losses.
71