Honeywell 2010 Annual Report Download - page 83
Download and view the complete annual report
Please find page 83 of the 2010 Honeywell annual report below. You can navigate through the pages in the report by either clicking on the pages listed below, or by using the keyword search tool below to find specific information within the annual report.-
 1
1 -
2
-
3
-
4
-
5
-
6
-
7
-
8
-
9
-
10
-
11
-
12
-
13
-
14
-
15
-
16
-
17
-
18
-
19
-
20
-
21
-
22
-
23
-
24
-
25
-
26
-
27
-
28
-
29
-
30
-
31
-
32
-
33
-
34
-
35
-
36
-
37
-
38
-
39
-
40
-
41
-
42
-
43
-
44
-
45
-
46
-
47
-
48
-
49
-
50
-
51
-
52
-
53
-
54
-
55
-
56
-
57
-
58
-
59
-
60
-
61
-
62
-
63
-
64
-
65
-
66
-
67
-
68
-
69
-
70
-
71
-
72
-
 73
73 -
 74
74 -
 75
75 -
 76
76 -
 77
77 -
 78
78 -
 79
79 -
 80
80 -
 81
81 -
 82
82 -
 83
83 -
 84
84 -
 85
85 -
 86
86 -
 87
87 -
 88
88 -
 89
89 -
 90
90 -
 91
91 -
 92
92 -
 93
93 -
94
-
95
-
96
-
97
-
98
-
99
-
100
-
101
-
102
-
103
-
104
-
105
-
106
-
107
-
108
-
109
-
110
-
111
-
112
-
113
-
114
-
115
-
116
-
117
-
118
-
119
-
120
-
121
-
122
-
123
-
124
-
125
-
126
-
127
-
128
-
129
-
130
-
131
-
132
-
133
-
134
-
135
-
136
-
137
-
138
-
139
-
140
-
141
-
142
-
143
-
144
-
145
-
146
-
147
-
148
-
149
-
150
-
151
-
152
-
153
-
154
-
155
-
156
-
157
-
158
-
159
-
160
-
161
-
162
-
163
-
164
-
165
-
166
-
167
-
168
-
169
-
170
-
171
-
172
-
173
-
174
-
175
-
176
-
177
-
178
-
179
-
180
-
181
-
182
-
183
 |
 |
HONEYWELL INTERNATIONAL INC.
NOTES TO FINANCIAL STATEMENTS—(Continued)
(Dollars in millions, except per share amounts)
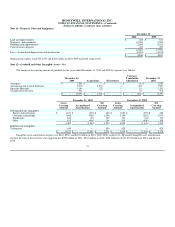
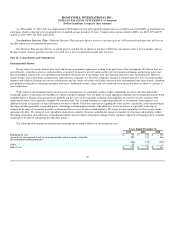
The carrying value of cash and cash equivalents, trade accounts and notes receivables, payables, commercial paper and short-term borrowings contained
in the Consolidated Balance Sheet approximates fair value. The following table sets forth the Company's financial assets and liabilities that were not carried at
fair value:
December 31, 2010 December 31, 2009
Carrying
Value
Fair
Value
Carrying
Value
Fair
Value
Assets
Long-term receivables $ 203 $ 199 $ 317 $ 303
Liabilities
Long-term debt and related current maturities $ 6,278 $ 6,835 $ 7,264 $ 7,677
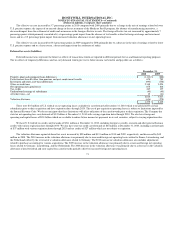
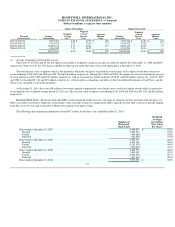
In the years ended December 31, 2010 and 2009, the Company had assets with a net book value of $32 million and $72 million, respectively,
specifically property, plant and equipment, software and intangible assets, which were accounted for at fair value on a nonrecurring basis. These assets were
tested for impairment and based on the fair value of these assets the Company recognized losses of $30 million and $28 million, respectively, in the years
ended December 31, 2010 and 2009, primarily in connection with our repositioning actions (see Note 3 Repositioning and Other Charges). The Company has
determined that the fair value measurements of these nonfinancial assets are level 3 in the fair value hierarchy.
The Company holds investments in marketable equity securities that are designated as available for sale securities. Due to an other-than-temporary
decline in fair value of these investments, the Company recognized an impairment charge of $62 million in the second quarter of 2009 that is included in
Other (Income) Expense.
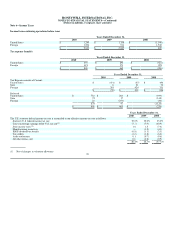
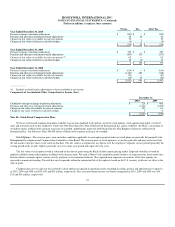
The derivatives utilized for risk management purposes as detailed above are included on the Consolidated Balance Sheet and impacted the Statement of
Operations as follows:
Fair value of derivatives classified as assets consist of the following:
December 31,
Designated as a Hedge Balance Sheet Classification 2010 2009
Foreign currency exchange contracts Accounts, notes, and other receivables $ 10 $ 8
Interest rate swap agreements Other assets 22 1
Commodity contracts Accounts, notes, and other receivables 2 4
December 31,
Not Designated as a Hedge Balance Sheet Classification 2010 2009
Foreign currency exchange contracts Accounts, notes, and other receivables $ 6 $ 3
Fair value of derivatives classified as liabilities consist of the following:
December 31,
Designated as a Hedge Balance Sheet Classification 2010 2009
Foreign currency exchange contracts Accrued liabilities $ 9 $ 1
Interest rate swap agreements Accrued liabilities — 3
Commodity contracts Accrued liabilities 2 —
December 31,
Not Designated as a Hedge Balance Sheet Classification 2010 2009
Foreign currency exchange contracts Accrued liabilities $ 5 $ 3
80